Figure 3.

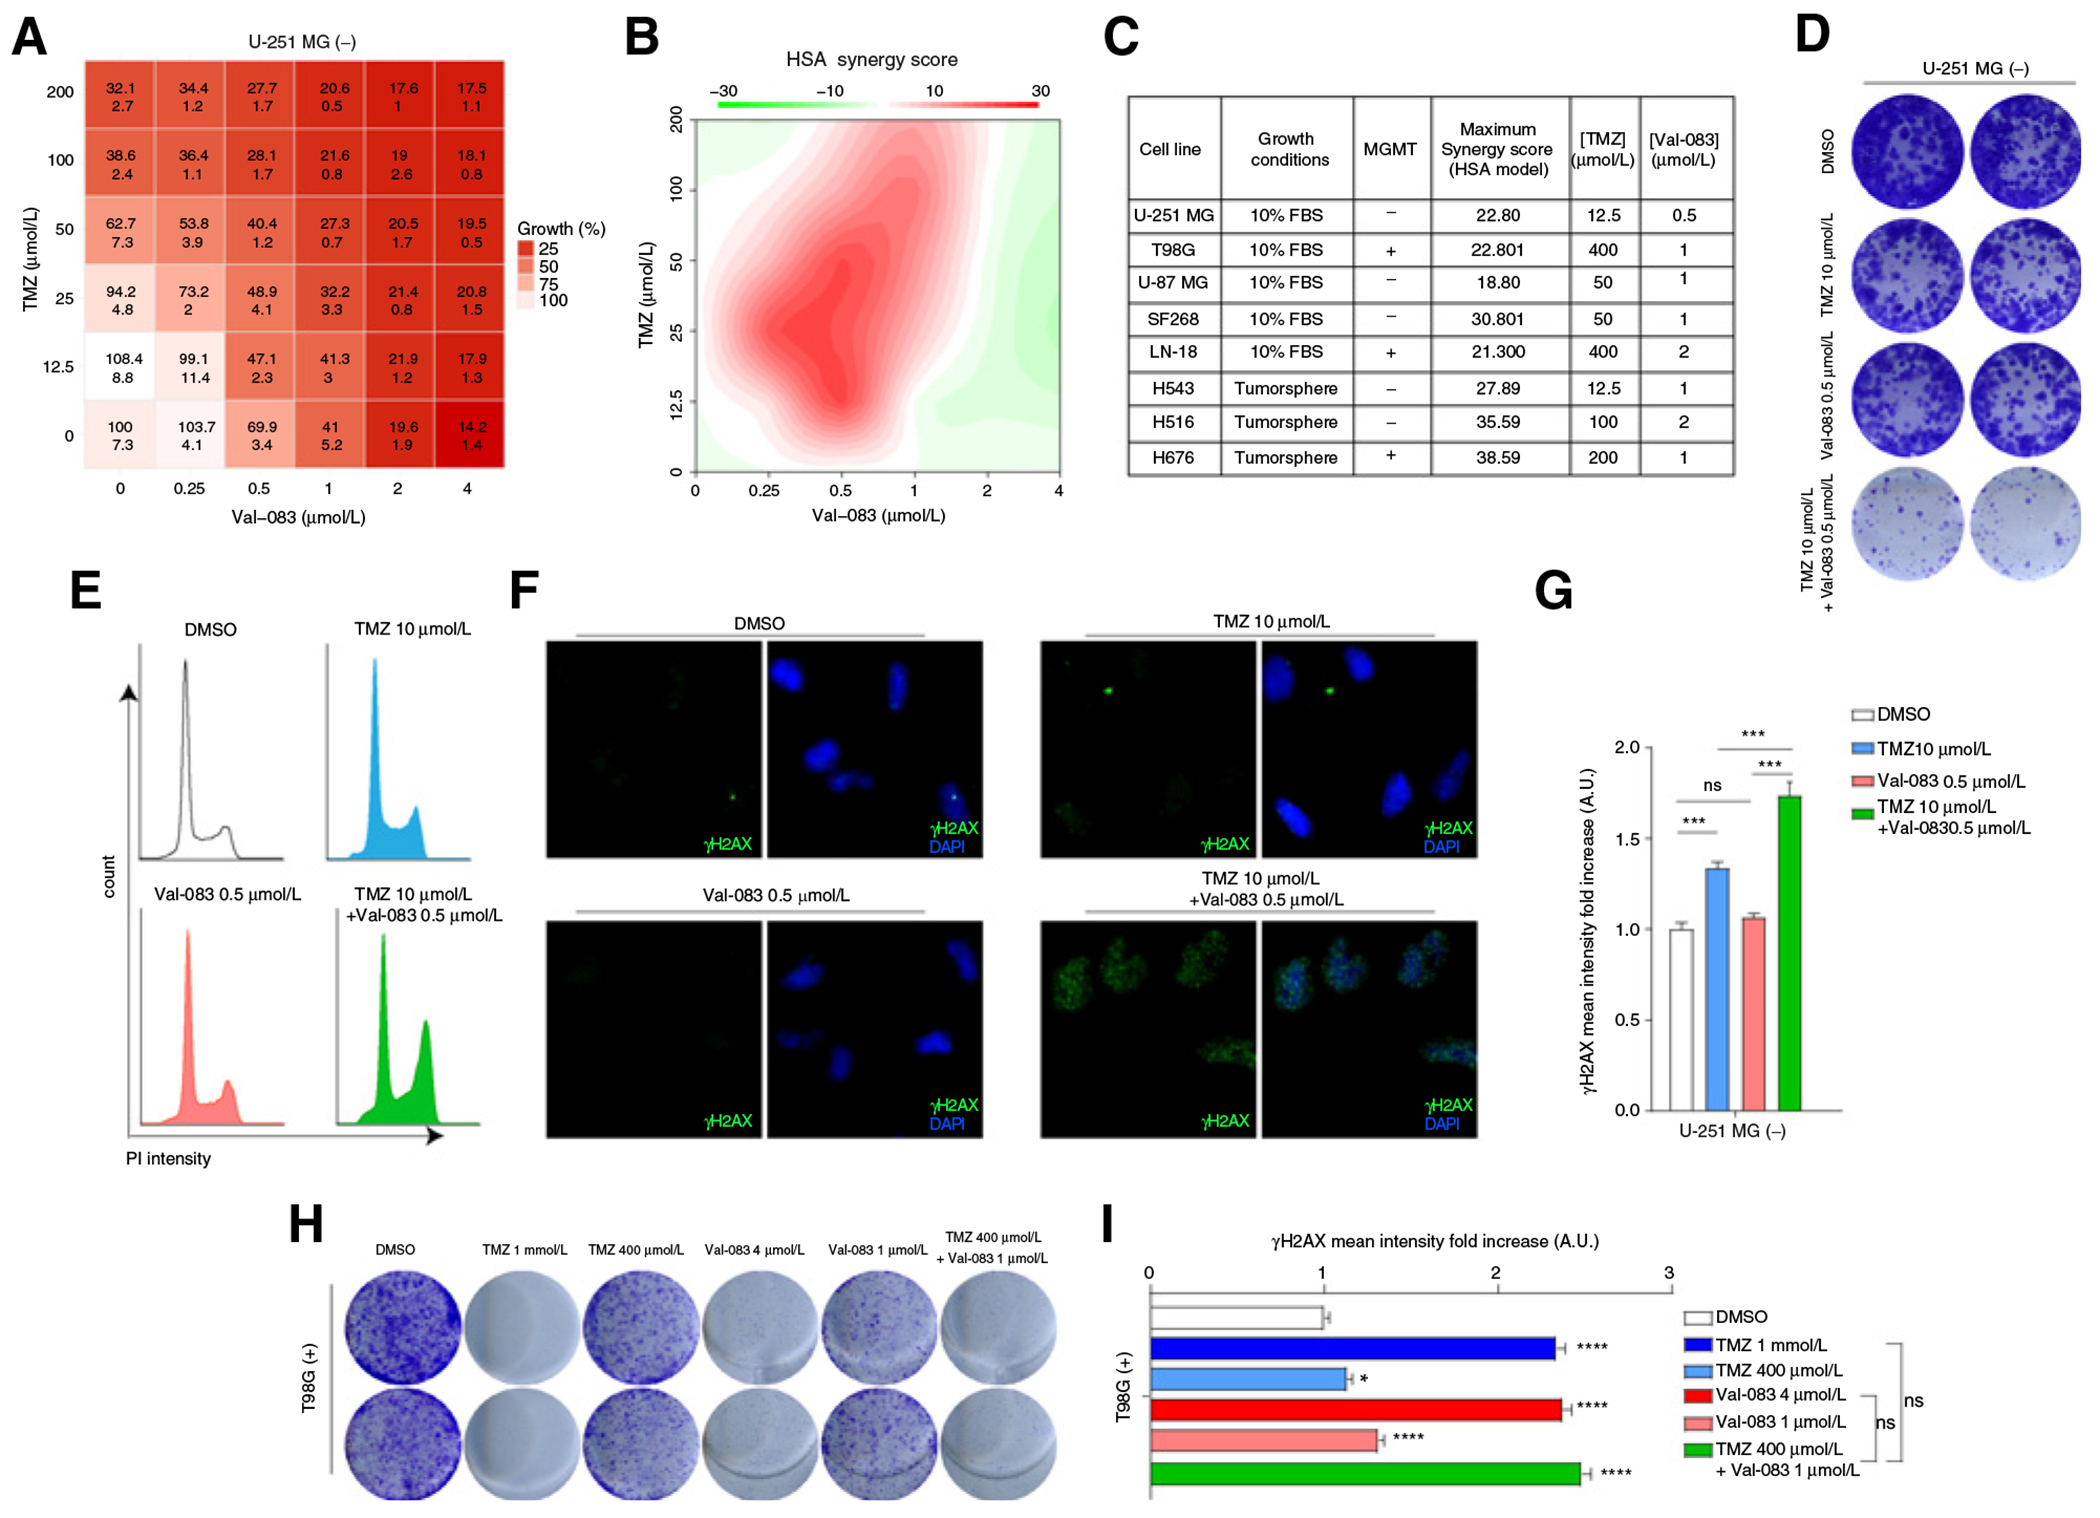
TMZ and Val-083 combination treatment show synergistic cytotoxic effect. A, Table showing the percentage of cell viability (as compared with DMSO, top number in each cell) and SD (bottom number). B, Plot of synergy score calculated with the HSA method of U-251 MG cells treated with different doses of TMZ and Val-083. C, Table showing the maximum synergy scores of different adherent cell lines (U-251 MG, T98G, U-87 MG, SF268, LN-18) and tumorspheres grown in suspension (H543, H516, H676), as well as the doses of TMZ and Val-083, which rendered said score. MGMT expression is also indicated. D, CFA of U-251 MG cells incubated with low doses of TMZ, Val-083, or the combination for 9 days. E, Cell-cycle profile of U-251 MG cells incubated for 48 hours with TMZ, Val-083, or the combination of both. F, Representative pictures of γH2AX staining of U-251 MG cells treated for 48 hours with DMSO, TMZ, Val-083, or the combination of the last two. G, Quantification of γH2AX signal intensity in nuclei of U-251 MG cells treated for 48 hours with TMZ, Val-083, or the combination of both. Statistical test (P values: ***, P < 0.001). H, CFA of T98G cells incubated with high and low doses of TMZ, Val-083, or the combination for 9 days. I, Quantification of γH2AX signal intensity in nuclei of T98G cells treated for 48 hours with TMZ, Val-083, or the combination of both. Statistical test: t test (P values: *, P < 0.05; ***, P < 0.001).
