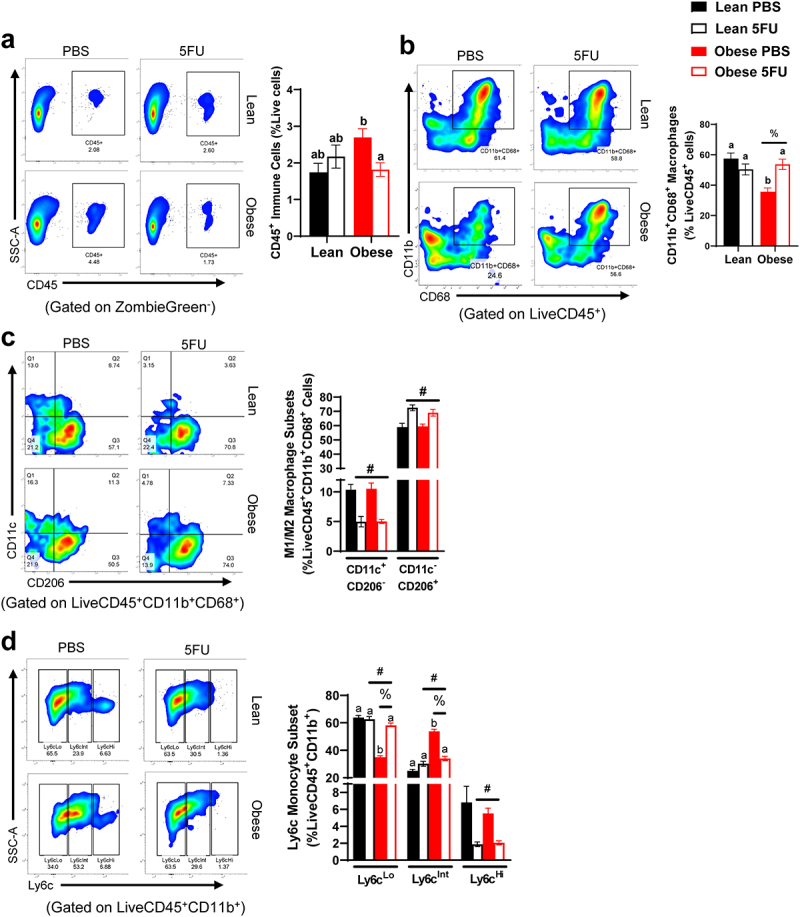
Figure 5.

Skeletal muscle immune cells. a) Representative flow plots of Cluster of Differentiation (CD) 45+ immune cells in all groups and quantified results shown as percent abundance among live cells. b) Representative flow plots of CD11b+CD68+ macrophages in all groups and quantified results shown as percent abundance among LiveCD45+ cells. c) Representative flow plots of CD11c x CD206 in all groups and quantified results shown as the percent abundance among LiveCD45+CD11b+CD68+. Quadrants indicate 4 distinct quantifiable populations, Q1: CD11c+CD206−, Q2: CD11c+CD206+, Q3: CD11c−CD206+, and Q4: CD11c−CD206−. d) Representative flow plots of Ly6cLo/Int/Hi monocytes/macrophages in all groups and quantified results shown as the percent abundance among LiveCD45+CD11b+ cells. Tertiles indicate 3 quantifiable populations, Ly6cLo, Ly6cInt, and Ly6cHi. Values are means ± SEM. Two-way ANOVA and LSD post hoc and multiple comparisons. #Indicates main effect of 5FU. %Indicates main effect of Obese. Different letters signify statistically significant differences with an interaction. Significance was set as p < .05.
