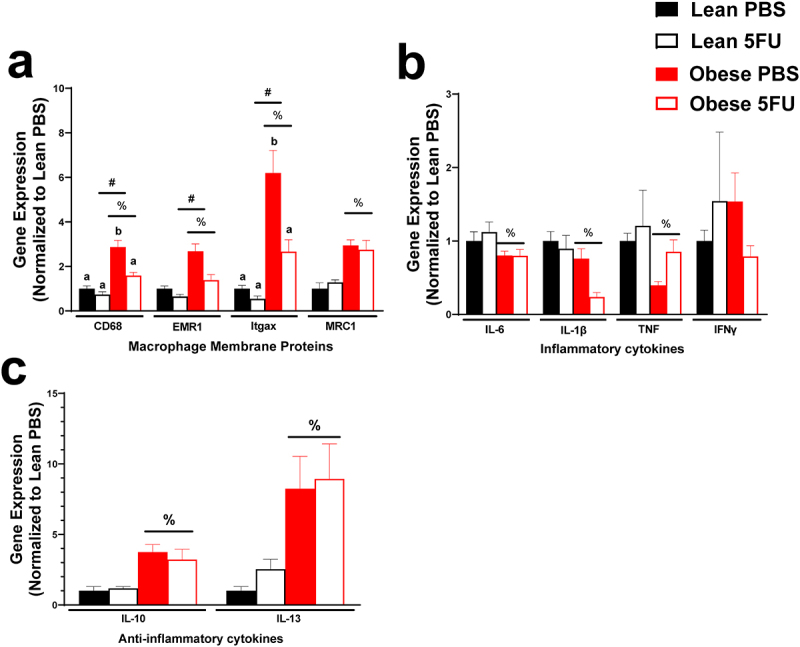
Figure 6.

Skeletal muscle inflammatory gene expression. a) Relative gene expression of macrophage surface proteins, cluster differentiation (CD) 68, EGF-like module-containing mucin-like hormone receptor-like 1 (EMR1; F4/80), Integrin, alpha X (Itgax; CD11c), and Mannose receptor C-type 1 (MRC1; CD206). b) Relative gene expression of inflammatory cytokines, Interleukin (IL) 6, IL-1β, tumor necrosis factor, and interferon (IFN) γ. c) Relative gene expression of anti-inflammatory cytokines IL-10 and IL-13. Gene values were normalized to vehicle treated controls and compared to five reference targets. Values are means ± SEM. Two-way ANOVA and LSD post hoc and multiple comparisons. #Indicates main effect of 5FU. %Indicates main effect of Obese. Different letters signify statistically significant differences with an interaction. Significance was set as p < .05.
