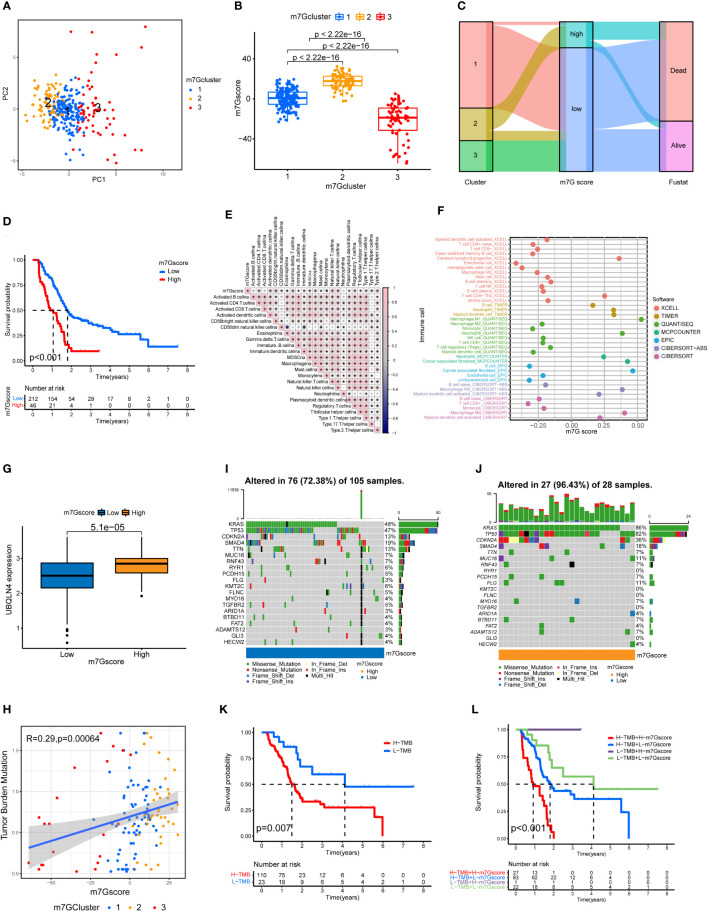
Figure 3.
Immune cell infiltration and genomic instability in the m7G score. (A) PCA of the m7G methylation genes. (B) The m7G scores for the three clusters of pancreatic cancers. (C) The Sankey plots revealed the correlation results of m7G clusters, m7G scores and the future state of patients. (D) Kaplan–Meier survival curves of the high m7G score group and the low m7G score group. (E) Spearman correlation analysis of the relationship between m7G scores and immune cell types *p<0.05. (F) Correlation of m7G score and immune cell infiltration through multiple software. (G) UBQLN4 expression in the high m7G score group and the low m7G score group. (H) Correlation analysis of the relationship between m7G scores and tumor mutation burden among the three clusters of PDAC. (I, J) Waterfall plot of gene mutation frequencies for low and high m7G score groups. (K) Kaplan–Meier survival curves of the high tumor mutation burden group and the low tumor mutation burden group. (L) Combined survival analysis results for the high and low tumor mutation burden groups and the high and low m7G score groups.

