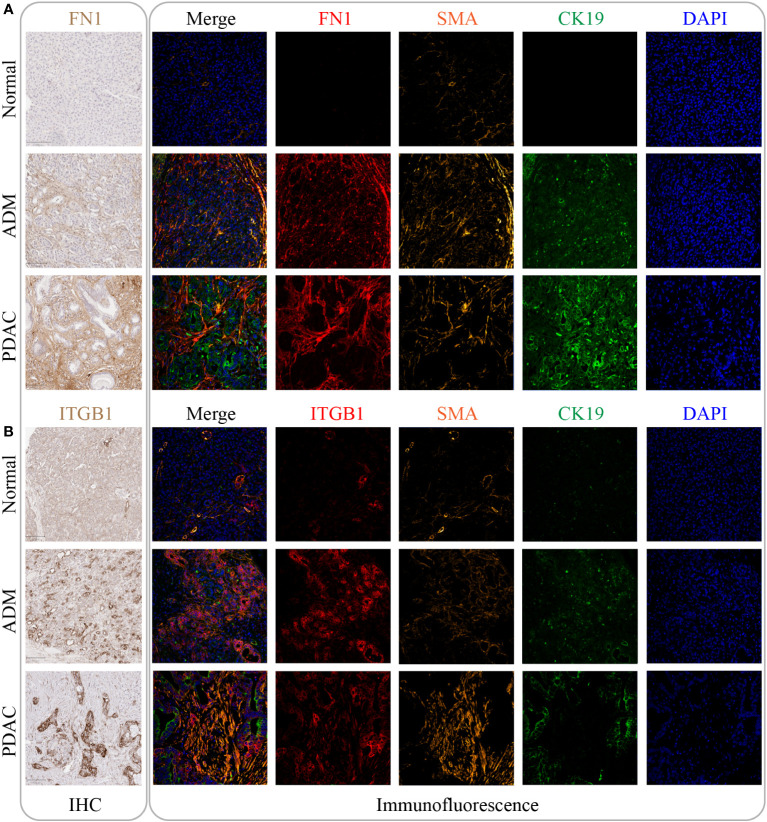
Figure 7.
The expression of FN1 and ITGB1 in normal tissue, ADM tissue and PDAC tissue. (A) The expression of FN1 was gradually increased by IHC and immunofluorescence. Its expression location was mainly in the intercellular substance. (B) The expression of ITGB1 was gradually increased by IHC and immunofluorescence. Its expression location was mainly inside the cancer cell.

