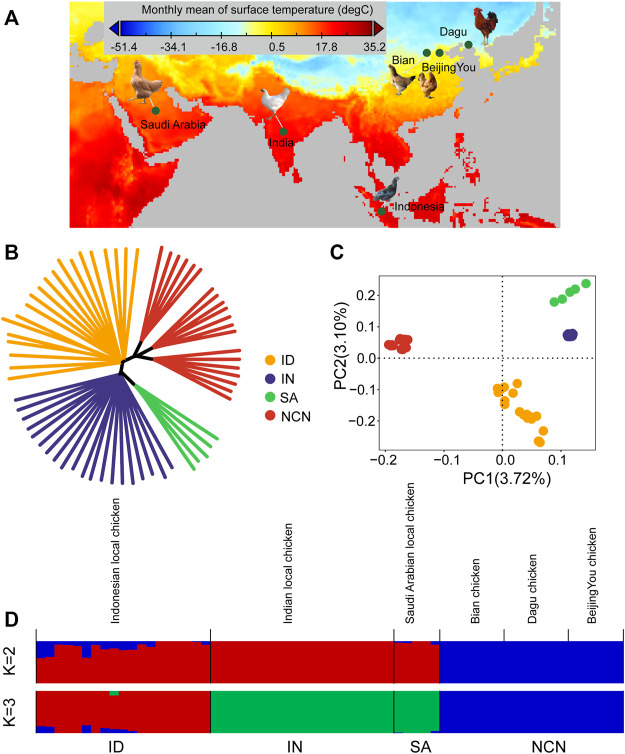
FIGURE 1.
Population structure and relationships of tropical chickens. (A) geographic variation of monthly mean surface temperature for the location of chickens used in the study. (B) neighbor-joining tree. (C) principal component analysis (PCA) with the first (PC1) and second (PC2) principal components. (D) genetic structure of all chicken groups using ADMIXTURE program with K = 2 and K = 3. Indonesian chickens (ID), Indian chickens (IN), Saudi Arabian chickens (SA), and chickens of northern China (NCN).

