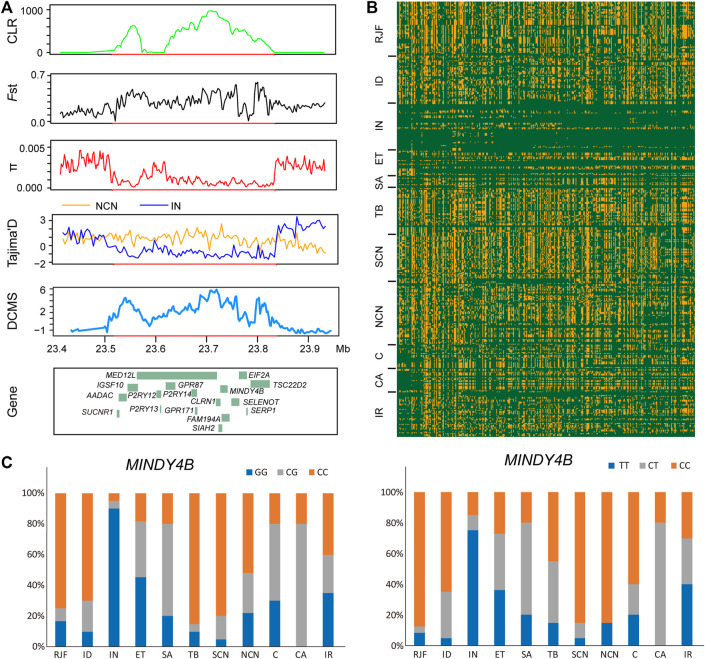
FIGURE 4.
A putative selective sweep region associated with hot tolerance in Indian chickens. (A) five sweep statistics plotted over a 280-Kb region on chromosome 9 detected by Indian chickens. From top to bottom, the vertical axis shows the values of CLR, Fst, π, Tajima’s D, and DCMS. (B) the degree of haplotype sharing around the region. (C) allele frequency of the mutant MINDY4B loci. Blue, orange, and gray represented homozygous mutant, heterozygous mutant, and homozygous wild type, respectively.

