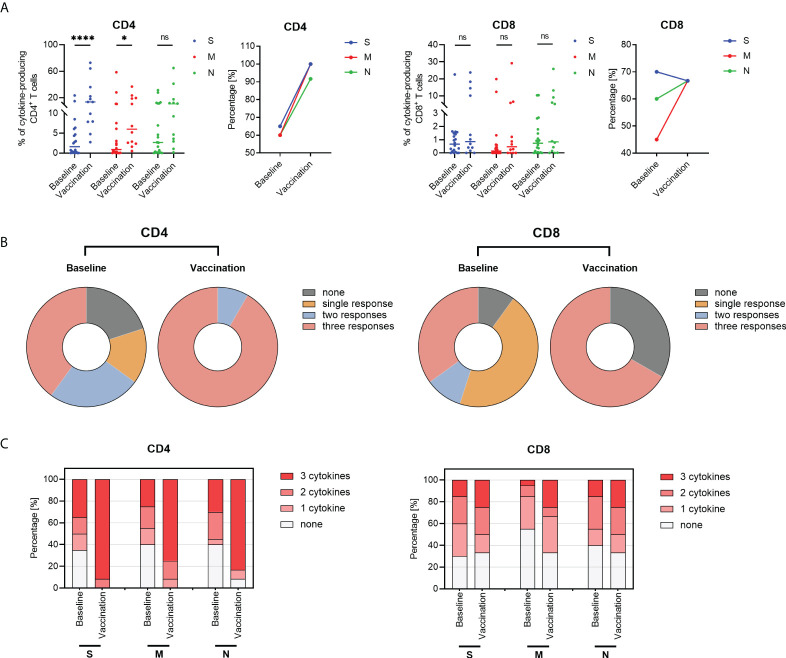
Figure 6.
SARS-CoV-2-specific cytokine-producing T cells responses in SARS-CoV-2 recovered (SR) patients. (A) The frequencies and positive response rate of overall SARS-CoV-2-specific CD4+ T cells in responses to overlapping peptide pools including spike (S, blue), membrane (M, red), and nucleocapsid (N, green) peptide in SARS-CoV-2 recovered individuals at baseline (n=20) and post-vaccination (n=12). Each dot indicates one subject and the short line represents the median value of each group. (B) The breadth of SARS-CoV-2-specific CD4+ and CD8+ T cell responses at baseline and post-vaccination. (C) The multi-functionality of CD4+ and CD8+ T cell responses in SARS-CoV-2 recovered patients at baseline and post-vaccination. Frequencies of cytokines-producing CD4+ and CD8+ T cells were calculated as the background (UN, unstimulated control) subtracted. The magnitude of overall T cell response refers to the sum of the frequencies of any cytokine (IFN-γ, IL-2, and TNF-α) with peptide pool stimulation. A T cell response was defined as a positive expression exceeding 2-fold UN. The number of peptide pools the T cells responding to was defined as the breadth of SARS-CoV-2-specific T cell responses. The number of producing-cytokines was defined as the functionality of SARS-CoV-2-specific T cell responses. Samples with non-response positive controls were excluded from further analysis. Kruskal-Wallis test followed by Dunn’s multiple comparisons test was used for statistical analysis. ns: no significance, *P < 0.05, ****P < 0.0001.

