
Extended data Fig. 2. Cortical Pdgfrα+EdU+ cells and identity of Pdgfrα- EDU+ cells.
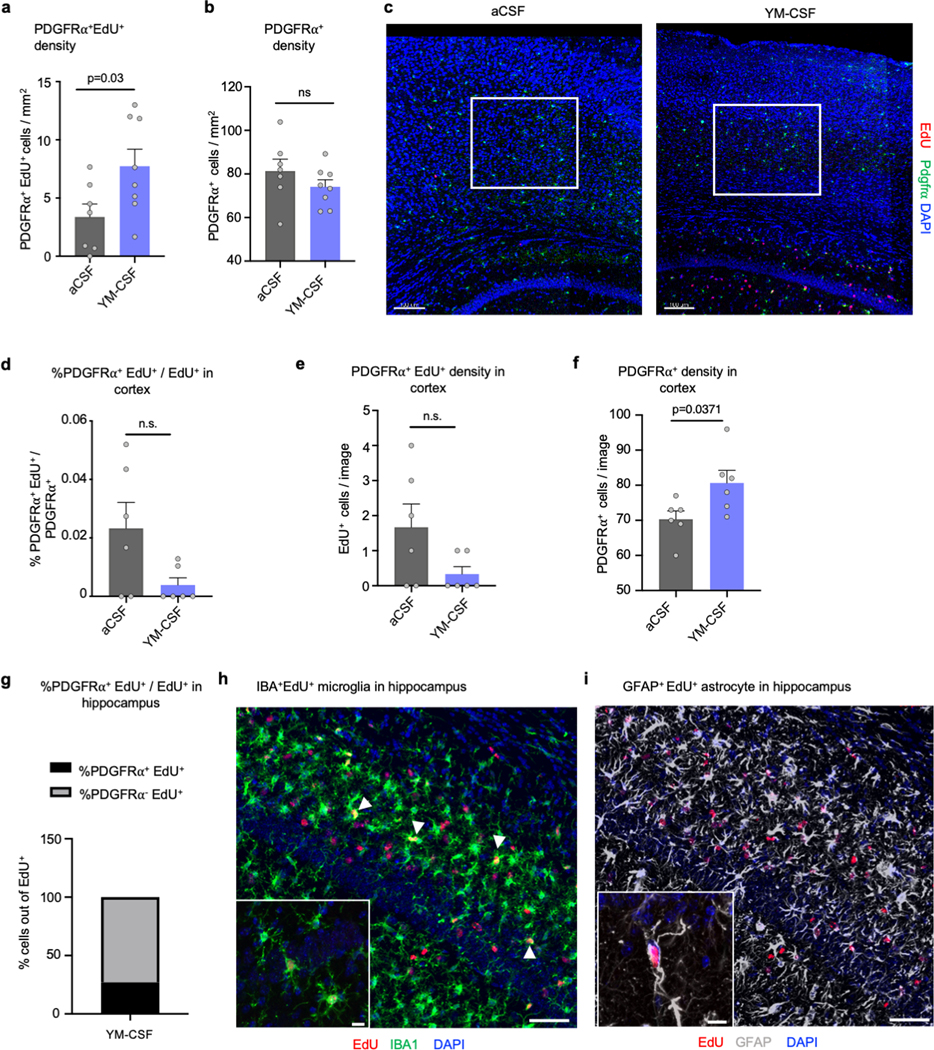
a, Hippocampal density of Pdgfrα+ EdU+ cells per mm2 (aCSF n=7, YM-CSF n=8; two-sided t-test; mean ± s.e.m.).
b, Hippocampal density of Pdgfrα+ cells per mm2 (aCSF n=7, YM-CSF n=8; two-sided t-test; mean ± s.e.m.).
c, Location of region of interest in the cortex. Scale bar, 100μm.
d, Percentage of Pdgfrα+ EdU+ / Pdgfrα+ cells showing very low proliferation rates of OPCs in the cortex (n=6; two-sided t-test; mean ± s.e.m.).
e, Cortical density of Pdgfrα+ EdU+ cells per mm2 (n=6; two-sided t-test; mean ± s.e.m.).
f, Cortical density of Pdgfrα+ cells per mm2 (n=6; two-sided t-test; mean ± s.e.m.).
g, Percentage of Pdgfrα+ EdU+ / EdU+ in the hippocampus of aged mice infused with YM-CSF (n=3).
h, Example of IBA+ EdU+ cells in the hippocampus (n=3). Scale bar, 50μm. Insert, 10μm.
i, Example of GFAP+ EdU+ cells in the hippocampus (n=3). Scale bar, 50μm. Insert, 10μm.