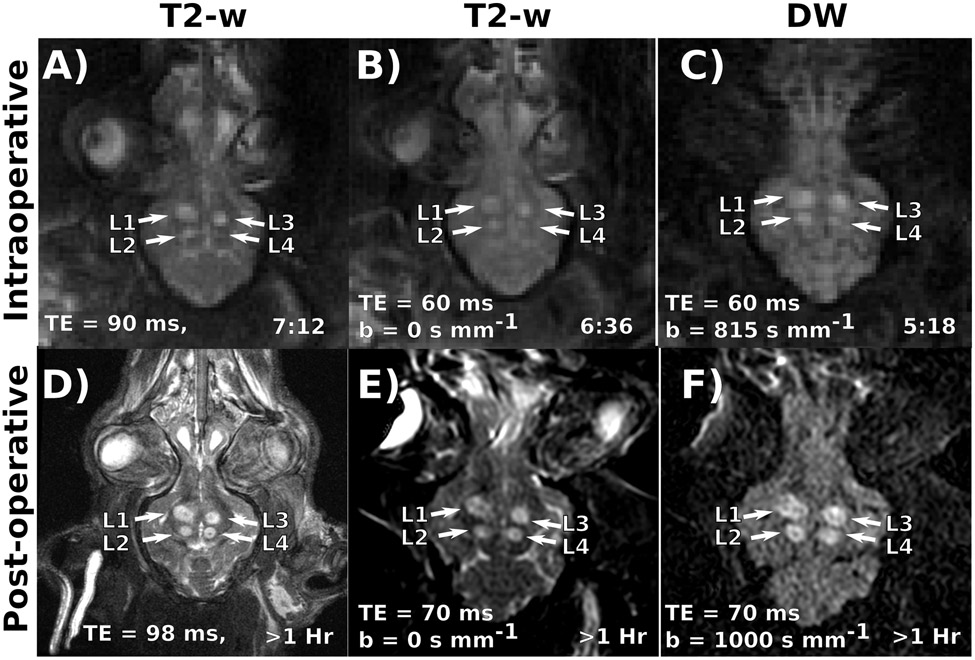
Figure 2:
(Top Row) Example Intraoperative T2-w (A, B), and diffusion-weighted images (C) in subject 5. Relevant contrast parameters and the time elapsed since ablating the fourth and final target are also displayed. Three lesions (labeled L1-3) demonstrate well developed T2-w contrast. However, L4 appears much more readily on the DW image. (Bottom Row) Example post-operative T2-w (D, E), and diffusion-weighted images (F) images of the same animal. Relevant contrast parameters and the time elapsed since ablating the fourth and final target are also displayed. By this point, all lesions have had time to develop T2-w contrast. Post-operative lesion morphology matches well with the intraoperative images.

