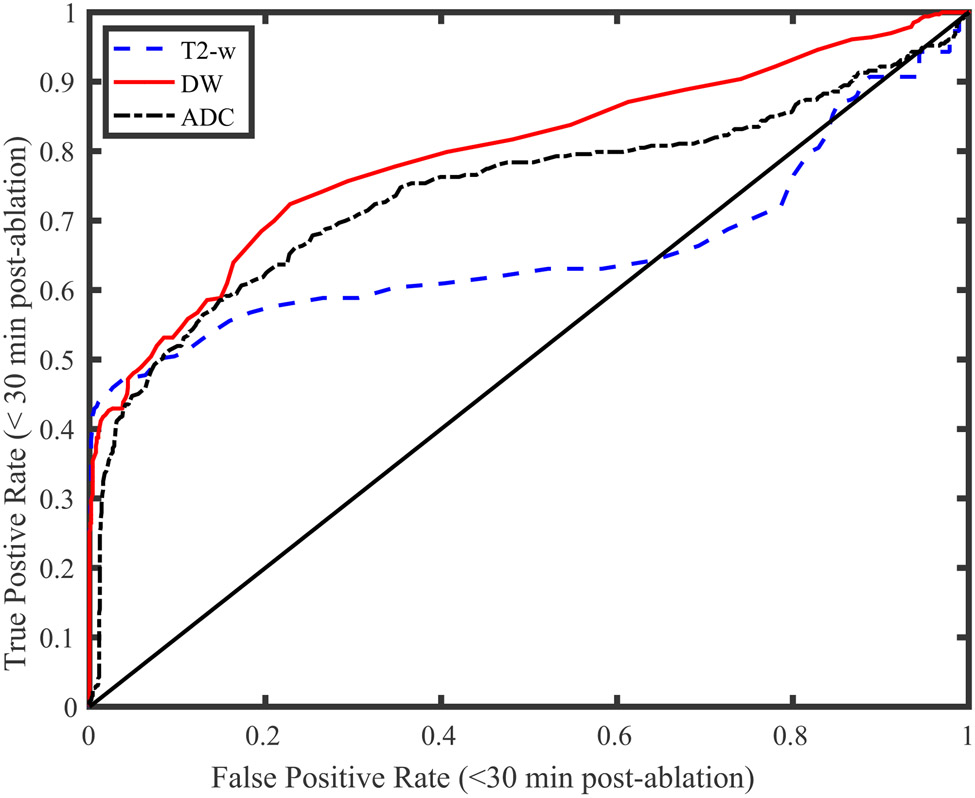
Figure 7:
Lesion detection ROC curves for several T2-w, DW, and ADC z score thresholds. These threshold were used to classify treated and untreated targets imaged within 35 minutes of treatment. The DW and ADC curves present nearly identical areas (0.69 and 0.68, respectively) while the T2-w curve presents an area of 0.49. The minimum distances to the upper left corners of the plot were 0.58, 0.41, and 0.55 for the T2-w, DW, and ADC z-scores, respectively.

