
Extended Data Fig. 6. Unsupervised self-organizing map (SOM) analysis in TCGA-LUSC tumors.
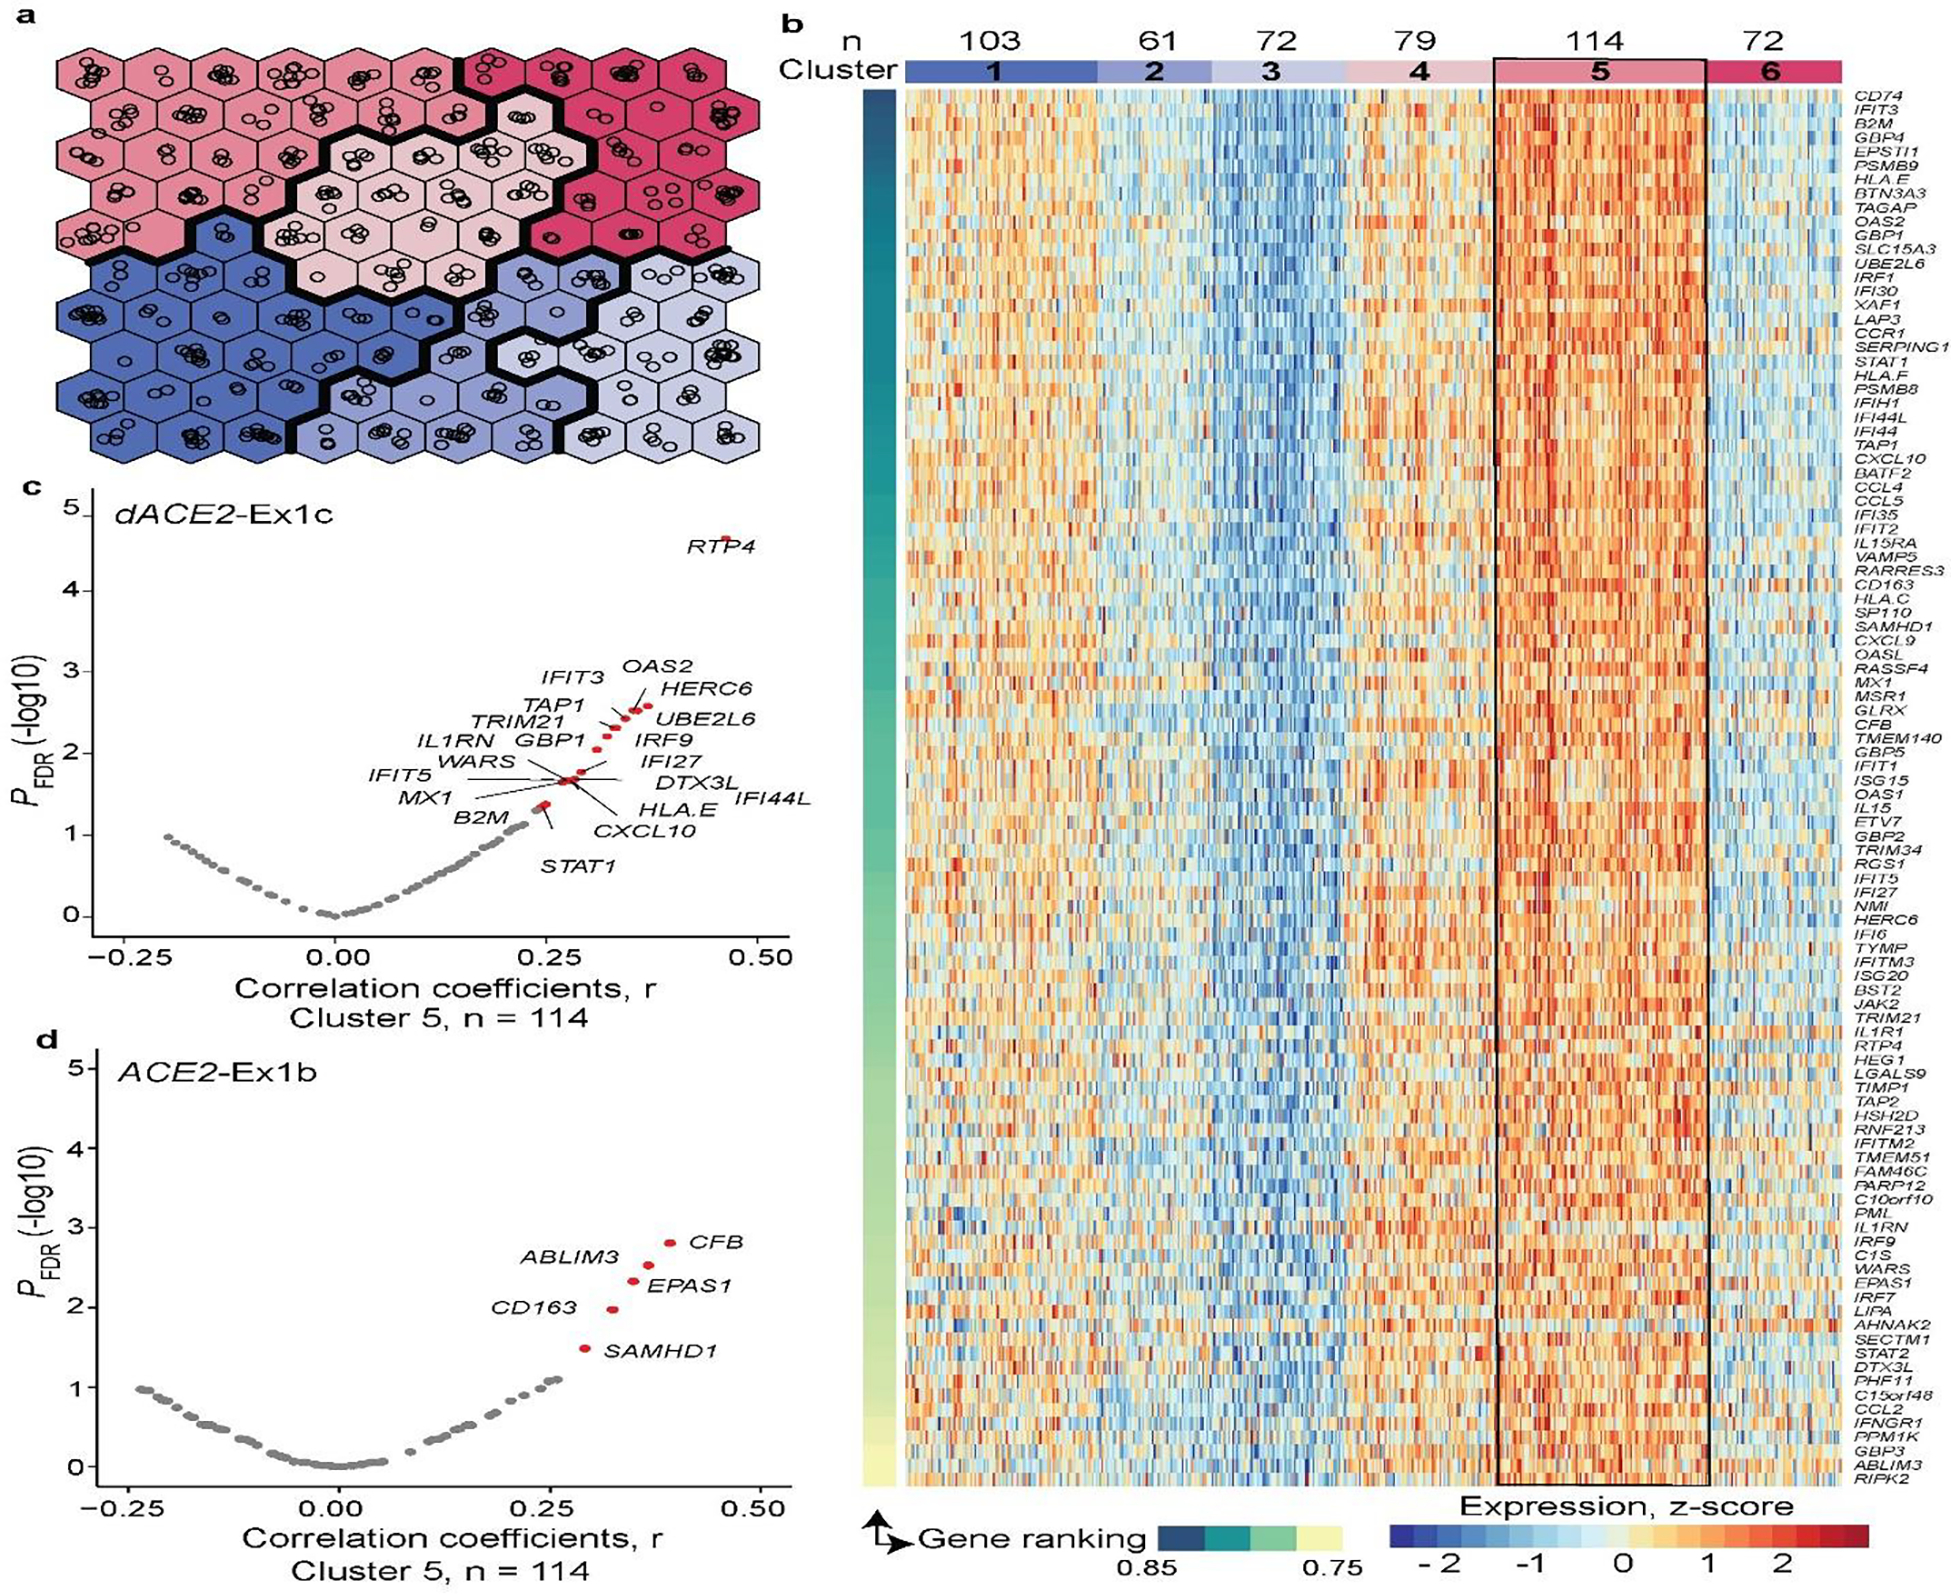
a, Construction of the unsupervised SOM of TCGA-LUSC tumors (n = 501) based on Z-scores calculated for each of the 270 curated ISGs. Each hexagon includes a mean of 5 (range 1–14) tumors with similar ISG expression profiles. Colors denote clusters (1–6) of tumors with similar ISG expression profiles. b, Heatmap of the six SOM-defined clusters, visualized by plotting the expression levels of top 100 ISGs selected by the ranking of the initial set of 270 ISGs based on their contribution to these clusters. Cluster 5 includes 114 tumors with the highest ISG expression, whereas cluster 3 includes 72 tumors with the lowest ISG expression. c, and d, Volcano plots showing FDR-adjusted p-values and Pearson correlation coefficients (r), for two-sided tests, for expression of dACE2 and ACE2 in relation to the expression of the top 100 ISGs within cluster 5. In total, dACE2 was significantly (FDR p-value < 0.05) correlated with the expression of 20 ISGs and ACE2—with 5 ISGs.