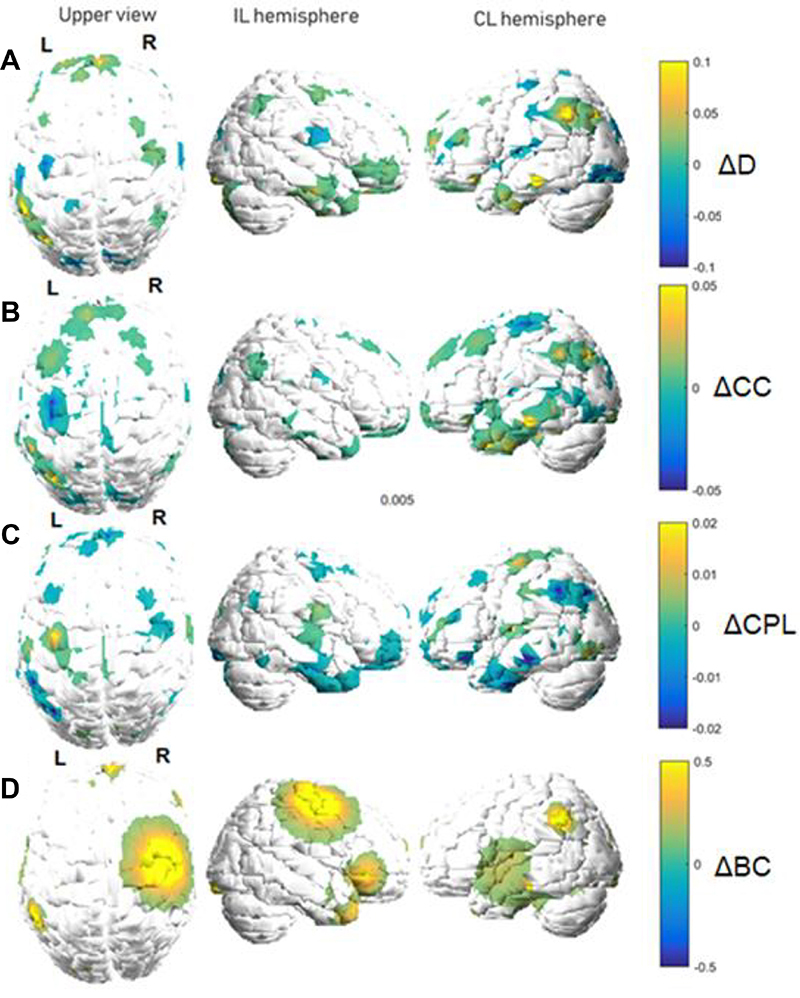
Figure 2. Graph metric changes between functional magnetic resonance imaging acquisitions (motor stroke group). Variations are shown in a relative color scale, according to Equation 6. A, degree (D); B, clustering coefficient (CC); C, characteristic path length (CPL); D, betweenness centrality (BC). IL: ipsilesional; CL: contralesional.

