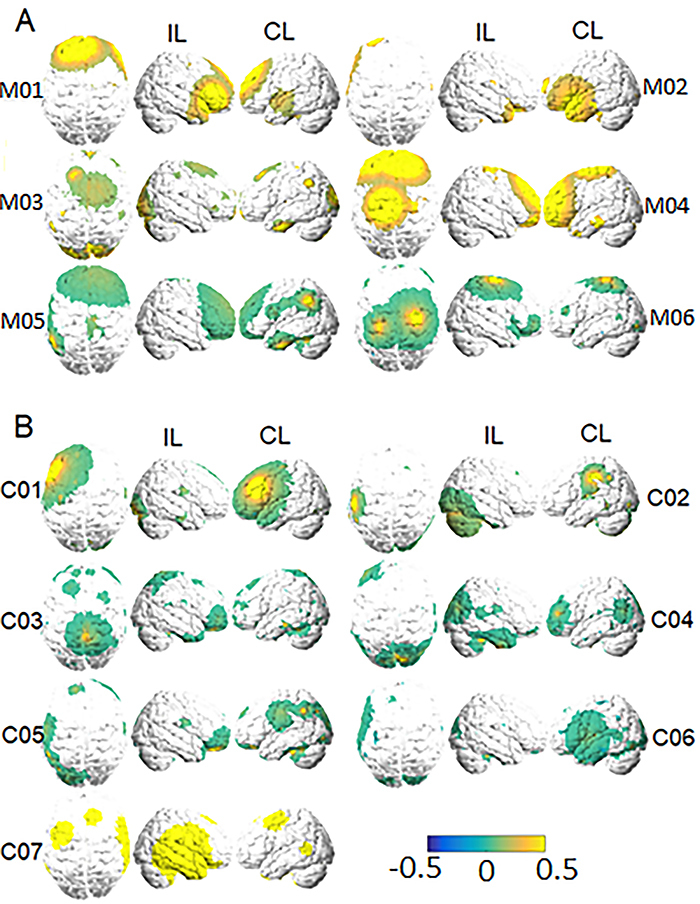
Figure 4. Individual betweenness centrality (BC) variation plots for the groups with (A) and without (B) motor-impairment. ‘IL' and ‘CL' indicate ‘ipsilesional' (the right hemisphere) and ‘contralesional' (the left hemisphere), respectively. Variations are shown in a relative color scale, according to Equation 6. Subjects from the motor stroke and control groups are labeled with ‘M' and ‘C', respectively.

