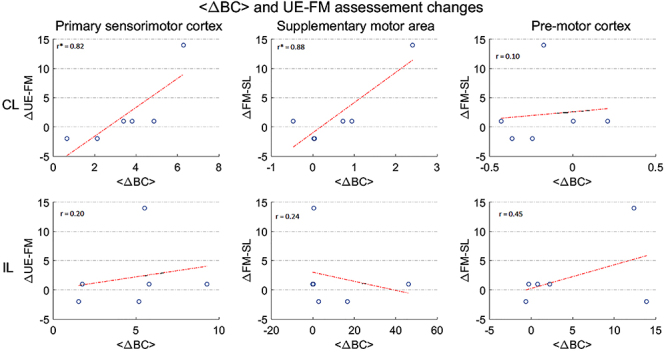
Figure 5. Relationship between upper-extremity Fugl-Meyer (UE-FM) scale changes and average betweenness centrality (BC) variation for the motor stroke group. In this plot, each point corresponds to the <ΔBC> and ΔUE-FM values of a subject. Plots in the upper and lower panels correspond to the contralesional (CL) and ipsilesional (IL) hemispheres, respectively. Each column designates <ΔBC> values gathered at specific areas. The correlation strength between the two variables, i.e., the <ΔBC> and the corresponding changes in UE-FM (indicated by ΔUE-FM), are shown as r, that indicates the value of the correlation coefficient. When the P corresponding to that rho is less than 0.05, the correlation is significant. The correlation strength between the two variables is shown with an asterisk (*) when significant (P<0.05).

