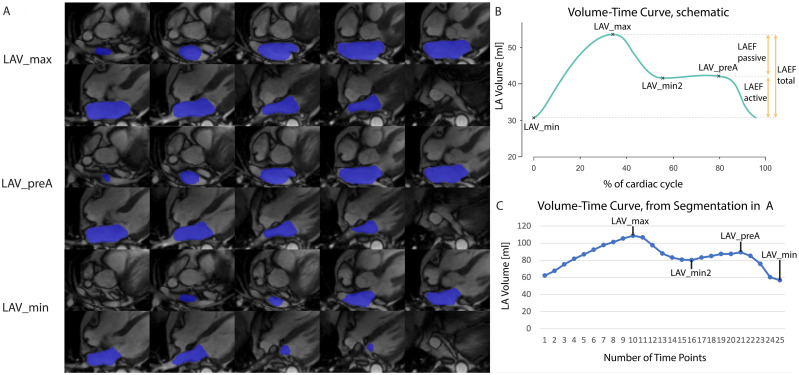
Fig 1. LA segmentation performed by the CNN.
A) Example case of LA segmentation performed by the CNN on oblique-axial CINE images. Segmentations are shown at the time point of maximum volume (LAV_max, top), volume before atrial contraction (LAV_preA, center) and minimum volume (LAV_min, bottom). B) Schematic volume-time curve to demonstrate the respective fiducial points for minimum LA Volume (LAV_min), maximum LA Volume (LAV_max), volume before atrial contraction (LAV_preA) and local minimum between LAV_max and LAV_preA (LAV_min2). C) volume-time curve of the case shown in (A) with all fiducial points identified.

