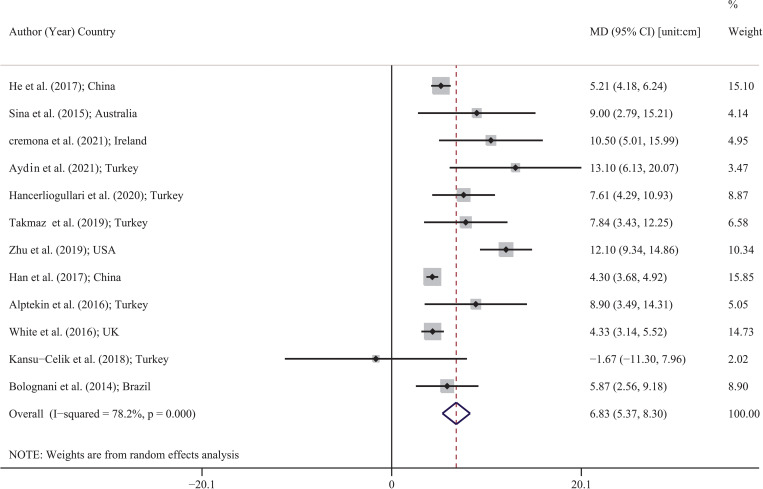
Fig 2. Forest plot for MD of waist circumference (cm) between GMD and non-GDM group based on a random effects model.
Each study is distinguished by its author (year) and countries. Each line segment’s midpoint shows the MD estimate; the length of line segment indicates 95% confidence interval (CI) in each study, and the diamond mark illustrates the pooled estimate of MD.

