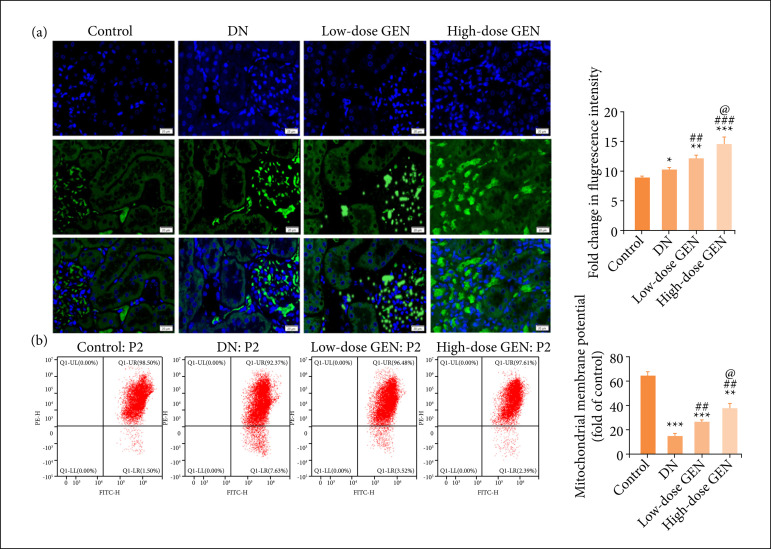
Figure 3. Effect of genistein (GEN) on mitochondria in diabetic nephropathy (DN) rats. (a) Immunofluorescence staining for mfn2 (20 μm, ×400 magnification). Green fluorescence: the expression of mfn2. Blue fluorescence: the nucleus reinfected with DAPI. The bar chart shows the quantitative analysis of fluorescence intensity. (b) JC-1 for mitochondrial membrane potential. Values are expressed as mean ± SD, n = 5 per group.
*p < 0.05 vs. control group; **p < 0.01 vs. control group; ***p < 0.001 vs. control group;

