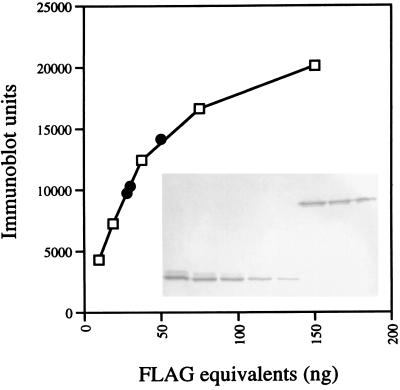
FIG. 2.
Quantitative Western blotting of PBP1-FLAG. Cells of strain LP27 were grown in 50 ml of 2× YT medium at 37°C, harvested, and broken by sonication and the membrane and cytoplasmic fractions were separated by high-speed centrifugation as described in Materials and Methods. Membranes were resuspended in 90 μl of buffer B (50 mM Tris-HCl [pH 8], 1 mM β-ME, 1 mM PMSF), and 5, 3, or 2 μl was brought to a 10-μl volume with buffer B, mixed with 10 μl of 2× SDS sample buffer, boiled for 4 min, and subjected to SDS–10% PAGE and immunoblotting with anti-FLAG antibody as described in the legend for Fig. 1A. The blot was scanned, and the relative amounts of FLAG molecules in the samples were determined by comparison with known amounts (range, 9.4 to 150 ng) of purified FLAG-BAP protein (Sigma), which were run on the same gel. The number of PBP1-FLAG molecules per cell was calculated as described in the text. The inset in the graph shows the blot with the different amounts of FLAG-BAP (lower band) and PBP1-FLAG (upper band). Open squares in the graph are values for FLAG-BAP standard protein; black circles are values for the different amounts of membranes from ponA-FLAG mutant cells loaded on the gel.

