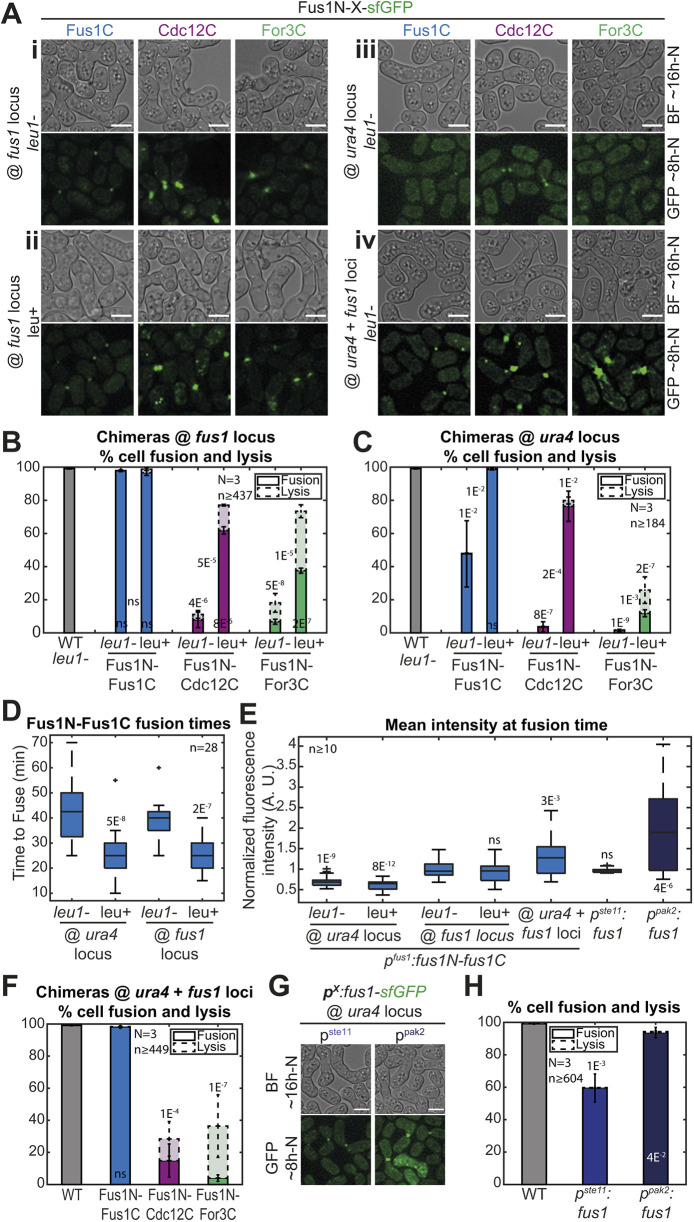
Fig. 2.
Leucine auxotrophy and formin expression levels have an impact on cell fusion. (A) DIC images ∼16 h post starvation and GFP fluorescence images ∼8 h post starvation of fus1Δ homothallic strains expressing the formin chimeras described in Fig. 1D, either (i) at the fus1 locus in leu1− cells, (ii) at the fus1 locus in leu+ cells, (iii) at the ura4 locus in leu1− cells, or (iv) at both ura4 and fus1 loci in leu1− cells. The same chimeras expressed at the ura4 locus in leu+ cells are shown in Fig. 1E. (B) Percentage of cell pair fusion and lysis 24 h after nitrogen removal in strains as in Ai-ii compared to the WT. P-values between bars compare leu1− and leu+ backgrounds. (C) Percentage of cell pair fusion and lysis 24 h after nitrogen removal in strains as in Aiii and Fig. 1E (same data as Fig. 1F shown for comparison here) compared to the WT. P-values between bars compare leu1− and leu+ backgrounds. (D) Boxplot of fusion times in strains expressing Fus1N-Fus1C as indicated. (E) Boxplot of the normalized mean total fluorescence intensity at fusion time in indicated strains. (F) Percentage of cell pair fusion and lysis 24 h after nitrogen removal in strains as in Aiv compared to the WT. All strains are leu1−. (G) DIC images ∼16 h post starvation and GFP fluorescence images ∼8 h post starvation of fus1Δ homothallic strains expressing Fus1-sfGFP from the ste11 or the pak2 mating-specific promoter at the ura4 locus. All strains are leu1−. (H) Percentage of cell pair fusion and lysis 24 h after nitrogen removal in strains as in G compared to the WT. All P-values are relative to WT unless indicated otherwise. Bars are 5 µm.

