Fig. 3.
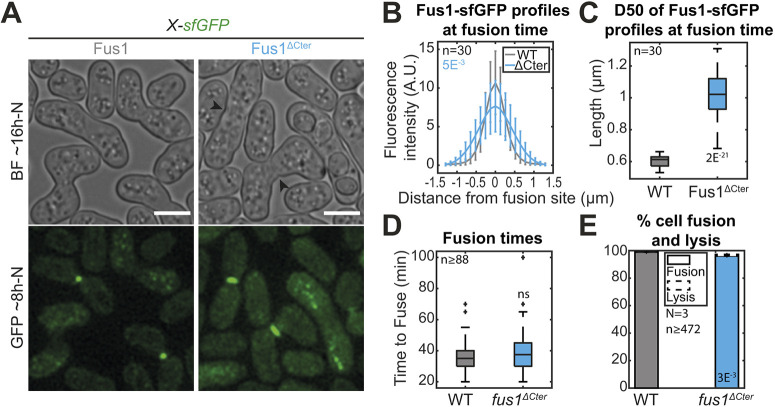
Deletion of Fus1 C-terminal tail leads to spreading of Fus1 localization but has only minor impact on fusion efficiency. (A) DIC images ∼16 h post starvation and GFP fluorescence images ∼8 h post starvation of strains expressing sfGFP-tagged Fus1 or Fus1ΔCter from the endogenous fus1 locus. Fus1ΔCter is cut just after the FH2 domain. Black arrowheads point to cell wall remnants in fused cells. (B) Profiles of Fus1-sfGFP bleach-corrected fluorescence intensities perpendicular to the cell pair long axis at fusion time in strains as in A. P-values are calculated at the curve maximum. (C) Boxplot of the width at half maximum of the fluorescence profiles shown in B. (D) Boxplot of fusion times in strains as in A. (E) Percentage of cell pair fusion and lysis 24 h after nitrogen removal in strains as in A. All P-values are relative to WT. Bars are 5 µm.

