Fig. 4.
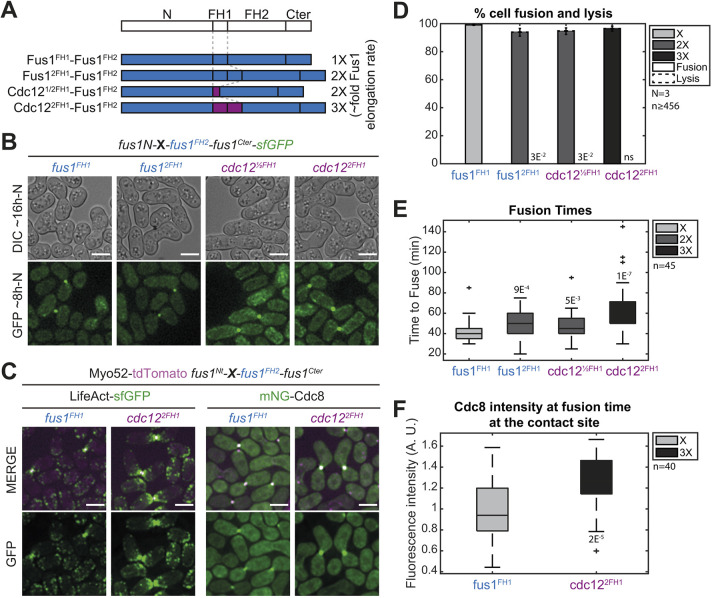
An increase in Fus1 actin elongation rate delays cell fusion. (A) Scheme of the constructs used in the figure. All constructs were constructed seamlessly and integrated at the endogenous fus1 locus. As they keep their N- and C-terminal regulatory parts and their FH2 domain constant, they are referred to only by their variable FH1 domain. Indicative actin filament elongation rates as measured in vitro on FH1-FH2 fragments by Scott et al. (2011) are shown on the right, as multiple of Fus1 elongation rate. (B) DIC images ∼16 h post starvation and GFP fluorescence images ∼8 h post starvation of homothallic strains expressing formin chimeras as in A, C-terminally tagged with sfGFP. (C) Merge and GFP fluorescence images ∼8 h post starvation of Myo52-tdTomato (magenta) and either (left) LifeAct-sfGFP or (right) mNG-Cdc8 in homothallic strains expressing untagged formin chimeras with Fus1FH1 or Cdc122FH1. (D) Percentage of cell pair fusion and lysis 24 h after nitrogen removal in strains as in B. (E) Boxplot of fusion times in strains as in B. (F) Boxplot of mNG-Cdc8 intensity normalized to the WT at the cell contact site at fusion time in strains as in C. All P-values are relative to WT. Bars are 5 µm.

