Fig. 6.
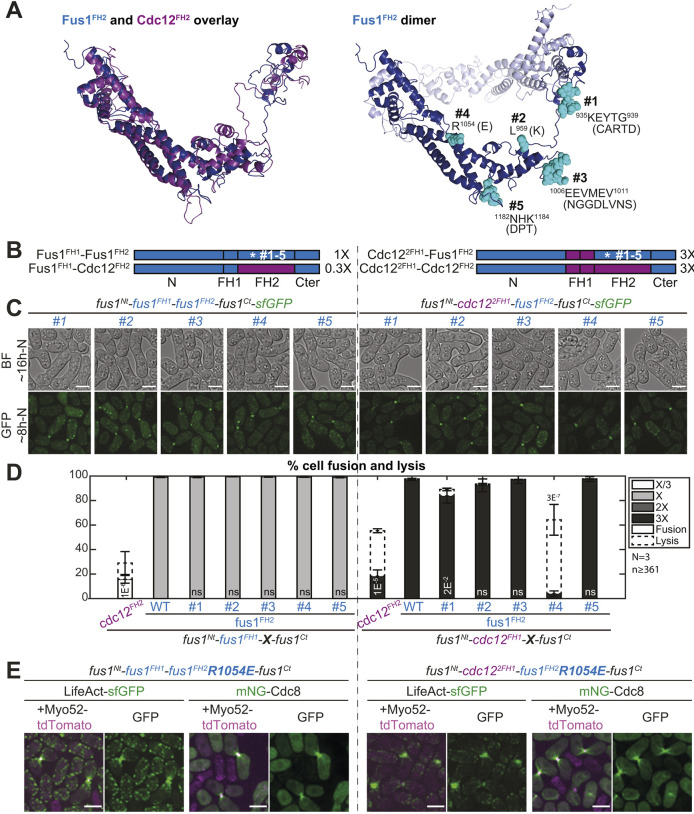
The R1054E mutation in Fus1 FH2 domain partly recapitulates the cell fusion deficiencies observed with Cdc12 FH2. (A) (Left) Overlay of Fus1 and Cdc12 FH2 domain structures, which were constructed by homology modeling with murine FMNL3. (Right) Dimeric Fus1 FH2 homology model with mutated residues shown in turquoise. Residues were selected in regions that were unlikely to disrupt the formin FH2 dimerization or actin binding, were surface-exposed and had a charge difference between Cdc12 and Fus1 or were in variable loops. (B) Scheme of the constructs used in the figure. All constructs were constructed seamlessly and integrated at the endogenous fus1 locus. The set of 5 mutations as shown in A were introduced in (left) Fus1 or (right) chimeras with Cdc122FH1. The latter shows identical elongation rate when combined with either Fus1FH2 or Cdc12FH2 [as indicated on the right from measurements in vitro on FH1-FH2 fragments by Scott et al. (2011)]. (C) DIC images ∼16 h post starvation and GFP fluorescence images ∼8 h post starvation of homothallic strains expressing either (left) mutant Fus1-sfGFP or (right) mutant sfGFP-tagged Cdc122FH1-Fus1FH2 formin chimeras. (D) Percentage of cell pair fusion and lysis 24 h after nitrogen removal in strains as in B compared to the non-mutated controls. P-values are relative to the non-mutated Fus1 controls. Chimeras with Cdc12FH2 are shown for information but note that Fus1FH1-Cdc12FH2 (left) cannot be used for direct comparison due to its lower elongation rate. (E) Merge and GFP fluorescence images ∼8 h post starvation of Myo52-tdTomato and either LifeAct-sfGFP or mNG-Cdc8 in homothallic strains expressing the untagged mutant formins Fus1R1054E (left) or Cdc122FH1-Fus1R1054EFH2 (right). Note the extended actin network, compared to non-mutated equivalents in Fig. 4C and Fig. 5E. Bars are 5 µm.

