. 2022 Mar 4;21(3):427–439. doi: 10.1158/1535-7163.MCT-21-0561

Figure 6.

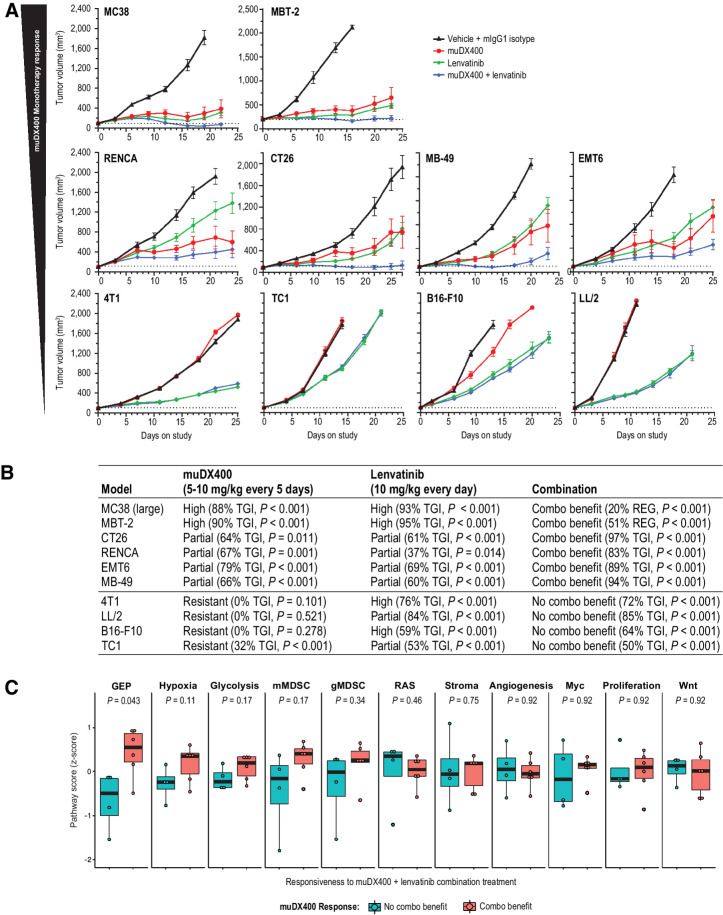
Figure 6. Antitumor efficacy of lenvatinib plus anti-PD-1 (muDX400) in syngeneic tumor models. A, Tumor growth curves for 10 subcutaneous syngeneic models treated with 5 mg/kg IgG1 isotype control antibody Q5D, 5 mg/kg muDX400 Q5D, 10 mg/kg lenvatinib QD, or muDX400 plus lenvatinib. Dotted lines represent tumor size at initiation of treatment. TGI and observations of complete or partial tumor regressions are indicated for each respective tumor regimen. B, The 10 models in A were classified as displaying improved efficacy when both agents were administered (combination benefit) or as no different from monotherapy with either agent (no combination benefit). The monotherapy response classification was as described in Fig. 1. C, Reference signature scores (Fig. 5) were evaluated at baseline and represented as mean z-score (of log2 FPKM values). P values shown represent the nominal Wilcox test P values. None of the signatures passed adjustment for multiple hypothesis testing. CR, complete response; Combo benefit, combination benefit; FPKM, fragments per kilobase million; GEP, gene expression profile; gMDSC, granulocytic myeloid–derived suppressor cells; muIgG1, mouse immunoglobulin G1; mMDSC, monocytic myeloid–derived suppressor cells; PD-1, programmed death 1; PR, partial response; QD, every day; Q5D, every 5 days; TGI, tumor growth inhibition.

Antitumor efficacy of lenvatinib plus anti-PD-1 (muDX400) in syngeneic tumor models. A, Tumor growth curves for 10 subcutaneous syngeneic models treated with 5 mg/kg IgG1 isotype control antibody Q5D, 5 mg/kg muDX400 Q5D, 10 mg/kg lenvatinib QD, or muDX400 plus lenvatinib. Dotted lines represent tumor size at initiation of treatment. TGI and observations of complete or partial tumor regressions are indicated for each respective tumor regimen. B, The 10 models in A were classified as displaying improved efficacy when both agents were administered (combination benefit) or as no different from monotherapy with either agent (no combination benefit). The monotherapy response classification was as described in Fig. 1. C, Reference signature scores (Fig. 5) were evaluated at baseline and represented as mean z-score (of log2 FPKM values). P values shown represent the nominal Wilcox test P values. None of the signatures passed adjustment for multiple hypothesis testing. CR, complete response; Combo benefit, combination benefit; FPKM, fragments per kilobase million; GEP, gene expression profile; gMDSC, granulocytic myeloid–derived suppressor cells; muIgG1, mouse immunoglobulin G1; mMDSC, monocytic myeloid–derived suppressor cells; PD-1, programmed death 1; PR, partial response; QD, every day; Q5D, every 5 days; TGI, tumor growth inhibition.