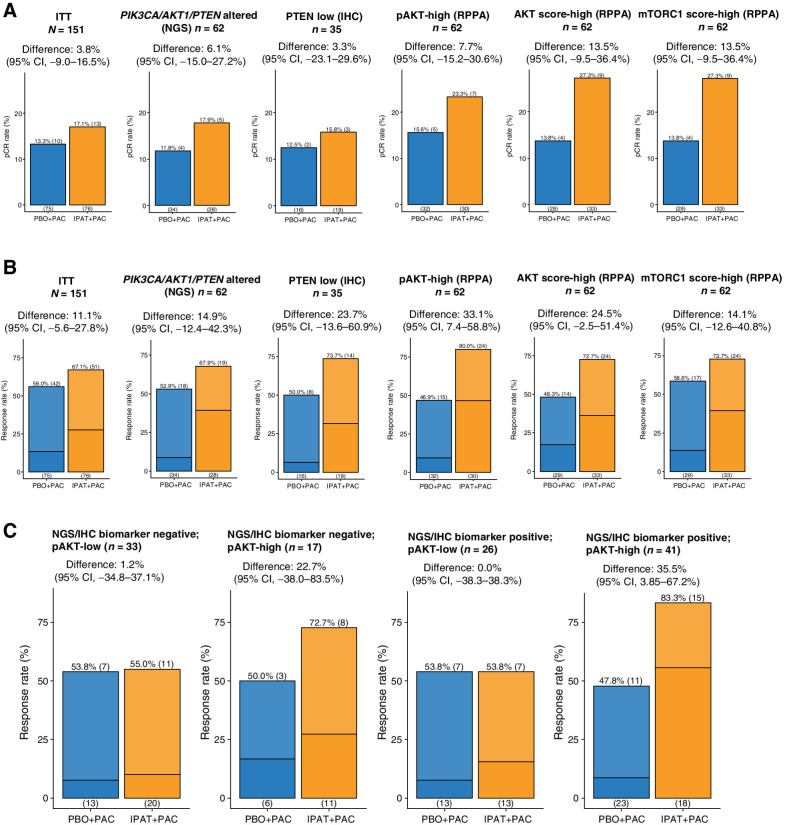
Figure 3.
High pAKT levels are associated with enriched benefit of ipatasertib treatment. A, Bar plot showing the pCR in the IPAT+PAC versus PBO+PAC arms, among different biomarker-selected patient subpopulations. B, Bar plot showing the ORR (MRI) in the IPAT+PAC versus PBO+PAC arms, among different biomarker-selected patient subpopulations. Darker color indicates CR and lighter color indicates PR. C, Analysis showing the ORR (MRI) in the pAKT-low and pAKT-high, among the NGS/IHC biomarker subgroups. NGS/IHC biomarker negative: PIK3CA/AKT1/PTEN nonaltered and PTEN intact; NGS/IHC biomarker positive: PIK3CA/AKT1/PTEN altered and/or PTEN low. 95% CI, 95% confidence interval; ITT, intention-to-treat.

