. 2021 Dec 13;28(5):993–1003. doi: 10.1158/1078-0432.CCR-21-2498

Figure 4.

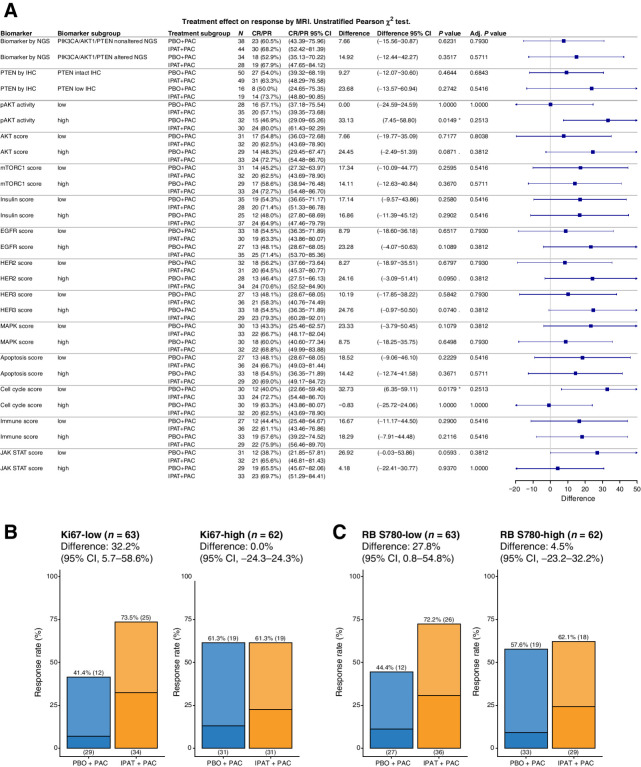
Figure 4. Ipatasertib increases the response rate of slow-dividing tumors. A, Forest plot showing the improvement in ORR with ipatasertib treatment among different biomarker subgroup(s). Signaling scores calculated from RPPA was dichotomized into the low and high subgroups using a median cut point. Pearson χ2 test was used to assess the difference in ORR with 95% confidence intervals (CI), comparing IPAT+PAC with PBO+PAC. (*) P value < 0.05, (.) 0.05 < P value <0.1. Bar plot showing the ORR (MRI) in the IPAT+PAC versus PBO+PAC arms, among Ki67-low and Ki-67 subgroups (B) or RB S780-low and RB S780-high subgroups (C). Darker color indicates CR and lighter color indicates PR. Adj., adjusted.

Ipatasertib increases the response rate of slow-dividing tumors. A, Forest plot showing the improvement in ORR with ipatasertib treatment among different biomarker subgroup(s). Signaling scores calculated from RPPA was dichotomized into the low and high subgroups using a median cut point. Pearson χ2 test was used to assess the difference in ORR with 95% confidence intervals (CI), comparing IPAT+PAC with PBO+PAC. (*) P value < 0.05, (.) 0.05 < P value <0.1. Bar plot showing the ORR (MRI) in the IPAT+PAC versus PBO+PAC arms, among Ki67-low and Ki-67 subgroups (B) or RB S780-low and RB S780-high subgroups (C). Darker color indicates CR and lighter color indicates PR. Adj., adjusted.