. 2021 Dec 6;28(4):629–636. doi: 10.1158/1078-0432.CCR-21-2272

Figure 3.

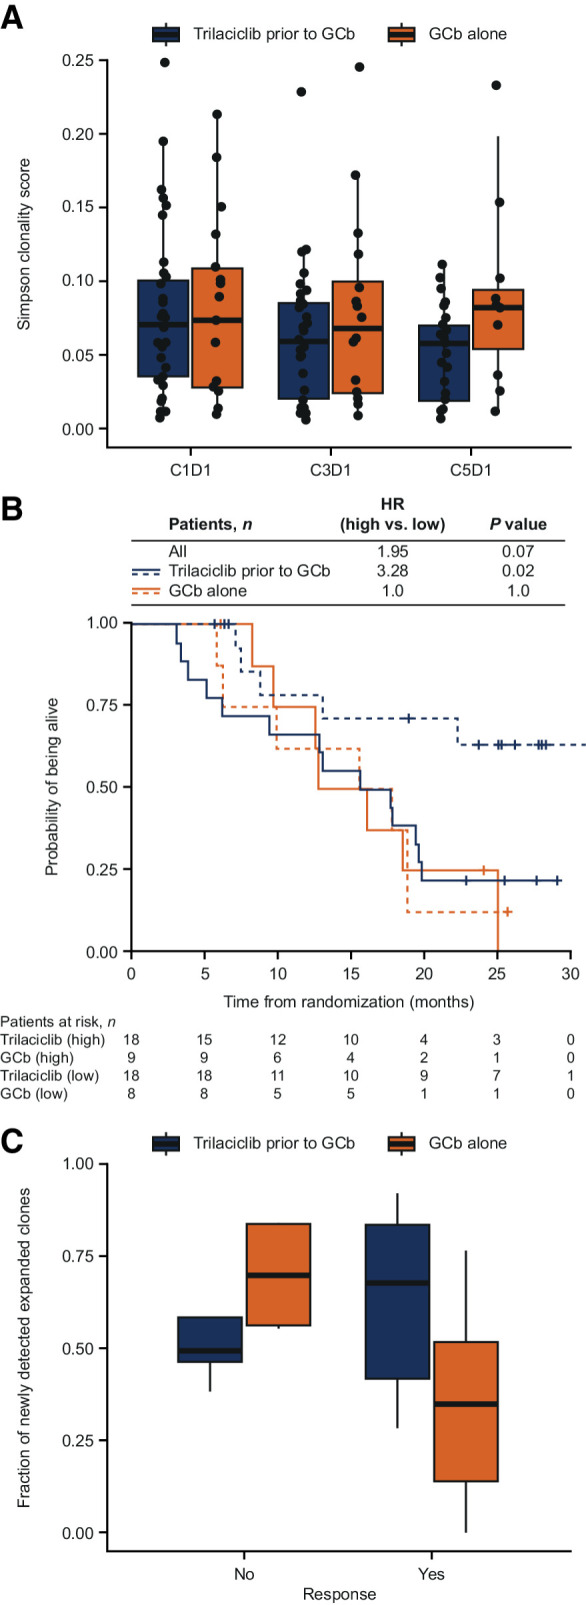
Figure 3. TCR clonality and expansion. A and C, Median values with 25% and 75% quartiles. B, Patients stratified by high (equal to or above median; solid lines) and low (below median; dashed lines) Simpson clonality scores. HR indicates ratio of high relative to low score. C, Data are from cycle 3, day 1. C, cycle; D, day.

TCR clonality and expansion. A and C, Median values with 25% and 75% quartiles. B, Patients stratified by high (equal to or above median; solid lines) and low (below median; dashed lines) Simpson clonality scores. HR indicates ratio of high relative to low score. C, Data are from cycle 3, day 1. C, cycle; D, day.