. 2022 Feb 11;21(4):568–581. doi: 10.1158/1535-7163.MCT-21-0518

Figure 1.

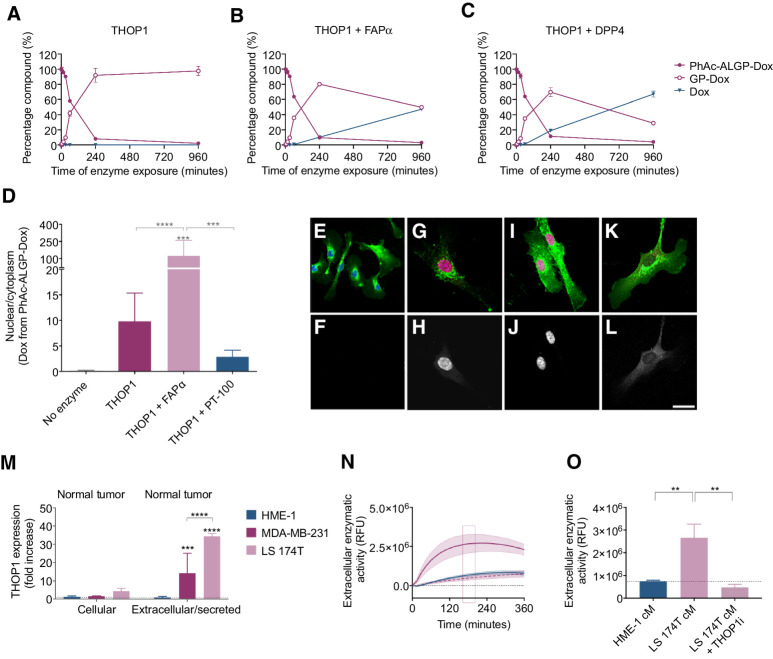
Figure 1. PhAc-ALGP-Dox is activated sequentially by extracellular THOP1 and cytoplasmic DPP4/FAPα in the tumor microenvironment. A–C, Generation of PhAc-ALGP-Dox cleavage products in the presence of recombinant enzymes (THOP1, 0.1 μg/mL; FAPα, 0.04 μg/mL; or DPP4, 0.04 μg/mL). Data are represented as mean ± SD of triplicate analysis, LoQ, 3 nmol/L. D, Quantification of Dox autofluorescence following exposure to 20 μmol/L PhAc-ALGP-Dox for 5 hours. Nuclear/cytoplasmic fluorescence was assessed in HUVEC cells in the presence of recombinant THOP1 (0.1 μg/mL) alone or together with either recombinant FAPα (0.04 μg/mL) or PT-100 (300 nmol/L), an inhibitor of FAPα/DPP4. Bars represent mean + SD of n = 8–12. Asterisks indicate significant differences versus no enzyme or as specified by brackets. ***, P < 0.001, ****, P < 0.0001 as defined by one-way ANOVA corrected for multiple comparisons (Holm–Sidak). E–L, Representative images of HUVEC cells stimulated with PhAc-ALGP-Dox alone (E, F), together with THOP1 (G, H), THOP1 and FAPα (I–J) or THOP1, and PT-100 (K, L). Top panels are merged images of cytoplasmic (Agglutinin, green), nuclear (DAPI, blue), or Dox (autofluorescence, red). Bottom panels are black-white images of Dox autofluorescence. Scale bar, 20 μm. M, Quantification of ELISA data of human THOP1 protein levels in cell lysates and conditioned media of cancer cells (MDA-MB-231 and LS 174T) compared with normal (HME-1) cells. Bars are mean + SD of three independent ELISAs run in duplicate. Asterisks indicate significant differences versus no enzyme or as specified by brackets. ***, P < 0.001, ****, P < 0.0001 as defined by one-way ANOVA corrected for multiple comparisons (Holm–Sidak). N, Kinetic activation of Dnp(k)-ALGP-CouAla by extracellular peptidases in normal (HME-1, blue) or tumor (LS 174T, purple) conditioned medium. Dashed purple line represents the signal in tumor conditioned media, preincubated with a THOP1 inhibitor (THOPi, 10 μmol/L). O, Quantification of Dnp(k)-ALGP-CouAla conversion after 180 minutes. Bars are mean + SD, pooled from three independent experiments (n = 6). **, P < 0.01 as defined by one-way ANOVA.

PhAc-ALGP-Dox is activated sequentially by extracellular THOP1 and cytoplasmic DPP4/FAPα in the tumor microenvironment. A–C, Generation of PhAc-ALGP-Dox cleavage products in the presence of recombinant enzymes (THOP1, 0.1 μg/mL; FAPα, 0.04 μg/mL; or DPP4, 0.04 μg/mL). Data are represented as mean ± SD of triplicate analysis, LoQ, 3 nmol/L. D, Quantification of Dox autofluorescence following exposure to 20 μmol/L PhAc-ALGP-Dox for 5 hours. Nuclear/cytoplasmic fluorescence was assessed in HUVEC cells in the presence of recombinant THOP1 (0.1 μg/mL) alone or together with either recombinant FAPα (0.04 μg/mL) or PT-100 (300 nmol/L), an inhibitor of FAPα/DPP4. Bars represent mean + SD of n = 8–12. Asterisks indicate significant differences versus no enzyme or as specified by brackets. ***, P < 0.001, ****, P < 0.0001 as defined by one-way ANOVA corrected for multiple comparisons (Holm–Sidak). E–L, Representative images of HUVEC cells stimulated with PhAc-ALGP-Dox alone (E, F), together with THOP1 (G, H), THOP1 and FAPα (I–J) or THOP1, and PT-100 (K, L). Top panels are merged images of cytoplasmic (Agglutinin, green), nuclear (DAPI, blue), or Dox (autofluorescence, red). Bottom panels are black-white images of Dox autofluorescence. Scale bar, 20 μm. M, Quantification of ELISA data of human THOP1 protein levels in cell lysates and conditioned media of cancer cells (MDA-MB-231 and LS 174T) compared with normal (HME-1) cells. Bars are mean + SD of three independent ELISAs run in duplicate. Asterisks indicate significant differences versus no enzyme or as specified by brackets. ***, P < 0.001, ****, P < 0.0001 as defined by one-way ANOVA corrected for multiple comparisons (Holm–Sidak). N, Kinetic activation of Dnp(k)-ALGP-CouAla by extracellular peptidases in normal (HME-1, blue) or tumor (LS 174T, purple) conditioned medium. Dashed purple line represents the signal in tumor conditioned media, preincubated with a THOP1 inhibitor (THOPi, 10 μmol/L). O, Quantification of Dnp(k)-ALGP-CouAla conversion after 180 minutes. Bars are mean + SD, pooled from three independent experiments (n = 6). **, P < 0.01 as defined by one-way ANOVA.