. 2022 May 2;21(7):1136–1148. doi: 10.1158/1535-7163.MCT-21-0791

Figure 2.

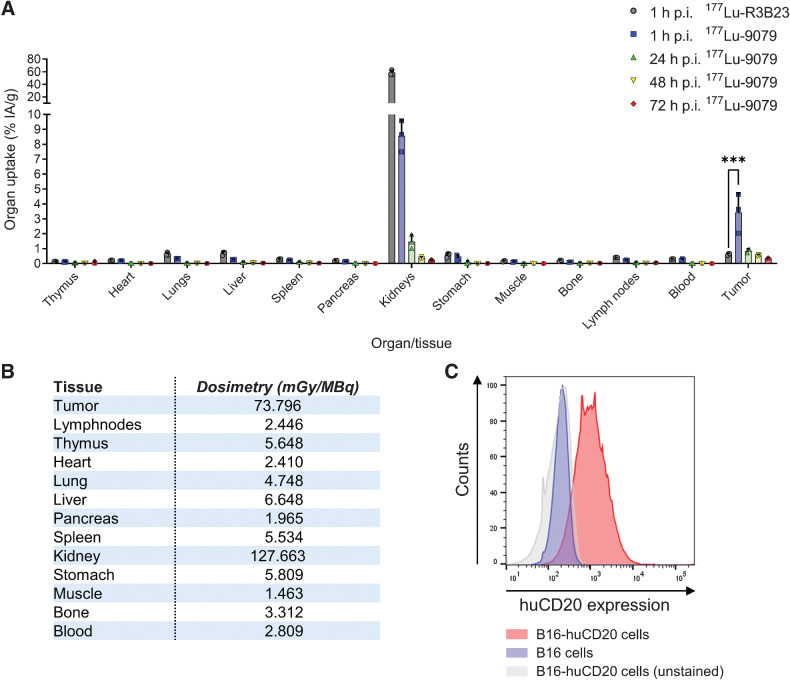
Figure 2. Ex vivo biodistribution data show specific accumulation of 177Lu-9079 in B16-huCD20 tumors. A, Accumulation of 177Lu-9079 and 177Lu-R3B23 was quantified at 1, 24, 48, and 72 hours postinjection, and 1 hour postinjection, respectively (N = 1, n = 3 per time-point). The bar graphs show individual datapoints and grouped mean %IA/g ± SD. B, Tissue dosimetry upon 177Lu-TRT was performed using trapezoid-exponential fitting. C, Histograms show expression of huCD20 on B16-huCD20 cells. h, hours; p.i., postinjection.

Ex vivo biodistribution data show specific accumulation of 177Lu-9079 in B16-huCD20 tumors. A, Accumulation of 177Lu-9079 and 177Lu-R3B23 was quantified at 1, 24, 48, and 72 hours postinjection, and 1 hour postinjection, respectively (N = 1, n = 3 per time-point). The bar graphs show individual datapoints and grouped mean %IA/g ± SD. B, Tissue dosimetry upon 177Lu-TRT was performed using trapezoid-exponential fitting. C, Histograms show expression of huCD20 on B16-huCD20 cells. h, hours; p.i., postinjection.