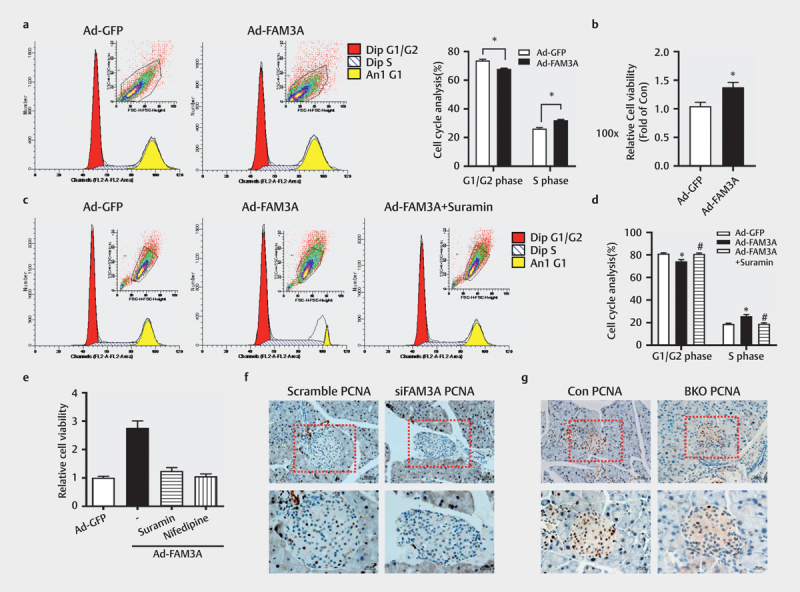
Fig. 7.

Intracellular ATP contributed to FAM3A-induced proliferation of pancreatic β cells. ( a ) The cell cycle analysis was performed after Ad-FAM3A infection in HIT-T15 cells. The left panel shows a representative image and the right panel shows a statistical graph. ( b ) MTT assay to analyze the effect of FAM3A overexpression on cell viability in HIT-T15 cells. In a MIN6 cell line, analysis of cell cycle showed the effect of suramin on FAM3A-induced cell proliferation. ( c ) Representative images of the cell cycle, ( d ) statistical graphs of panel ( c ). ( e ) Cells exposed to suramin and nifedipine for 24 h weakened the effect of FAM3A on cell viability. Immunohistochemical staining of PCNA in ( f ) acute FAM3A knockdown mice and ( g ) β cell-specific FAM3A gene knockout (BKO) mice. N=4–5, *P<0.05 vs. Ad-GFP, #P<0.05 vs. Ad-FAM3A.
