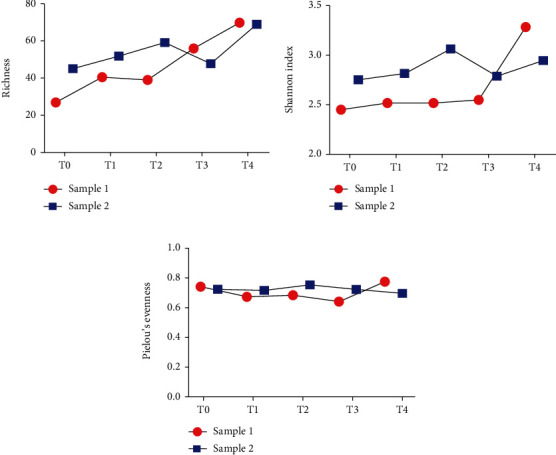
Figure 4.

Alpha diversity analysis of fecal bacterial communities after fecal microbiota transplantation. Species richness (a), Shannon diversity index (b), and equitability, as Pielou's evenness values (c) were compared among T0 (before fecal transplantation) and T1-3 (after fecal microbiota transplantation).
