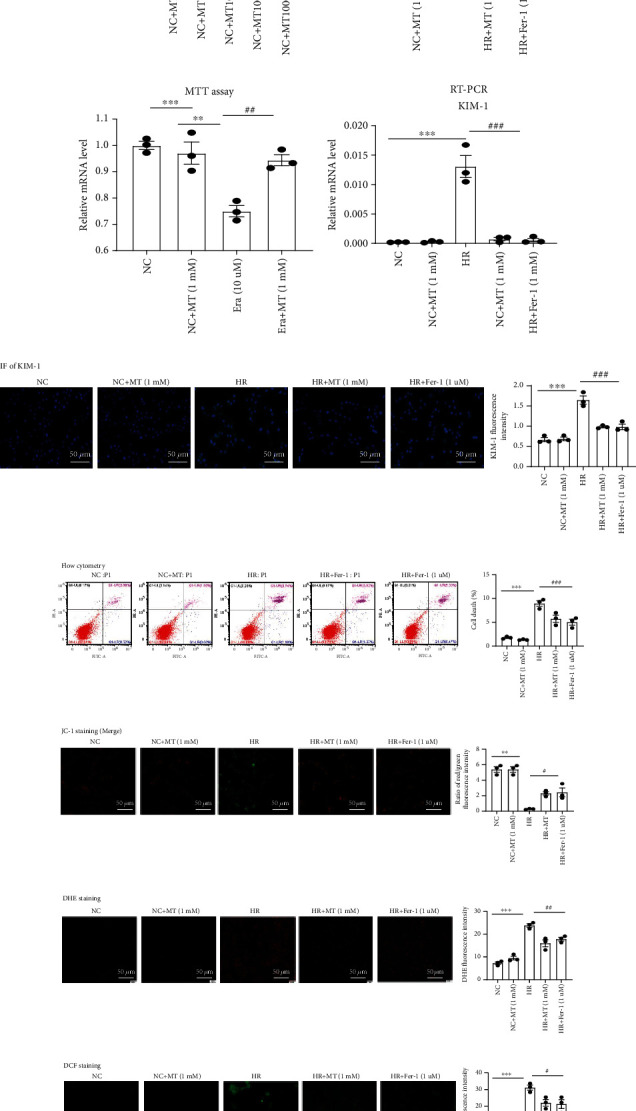
Figure 6.

Melatonin reduces the HR-induced cell death, mitochondrial dysfunction, and ROS production. (a) Cells were treated with melatonin (10–10,000 μM) for 24 h and then assessed using the MTT assay. ∗p < 0.05 vs. the NC group. (b, c) The MTT assay was used to evaluate the effects of melatonin and Fer-1 on HR- or Era-induced cytotoxicity. MTEC were pretreated with or without 1 mM melatonin or 1 μM Fer-1 for 6 h and then treated with HR or 10 μM Era. (d, e) Real-time PCR and immunofluorescence analysis of KIM-1 in MTEC. (f) The death of MTECs induced by HR was analyzed by flow cytometry. The results showed that melatonin and Fer-1 could reduce MTECs death induced by HR. (g) mitochondrial membrane potential (MMP) measured using JC-1. In the normal MTEC, most JC-1 formed J-aggregates and showed red fluorescence at 525/590 nm; in damaged MTEC, most JC-1 became monomer in mitochondrial matrix because Δψm decreased and showed green fluorescence at 490/530 nm. Under an inverted fluorescence microscope, we merged both the JC-1 pictures in 525/590 nm and 490/530 nm in the same field to acquire the pictures of Δψm. The NC or NC+MT (1 mM) MTEC mainly showed red fluorescence; in the HR group, green fluorescence increased and red fluorescence lessened, which was reversed in the MT (1 mM) and Fer-1 (1 μM) groups. (h, i) DHE and DCF staining were used to measure ROS production in MTEC. Results showed that ROS were upregulated induced by HR, and melatonin and Fer-1 could reduce the upregulation of ROS induced by HR. Data represent the mean ± SEM of 3–4 independent experiments. ∗p < 0.05, ∗∗p < 0.01, and∗∗∗p < 0.001 compared to the NC and NC+MT (1 mM) groups. #p < 0.05, ##p < 0.01, and###p < 0.001 compared with the HR- or Era-treated group. Scale bars = 20-50 μm.
