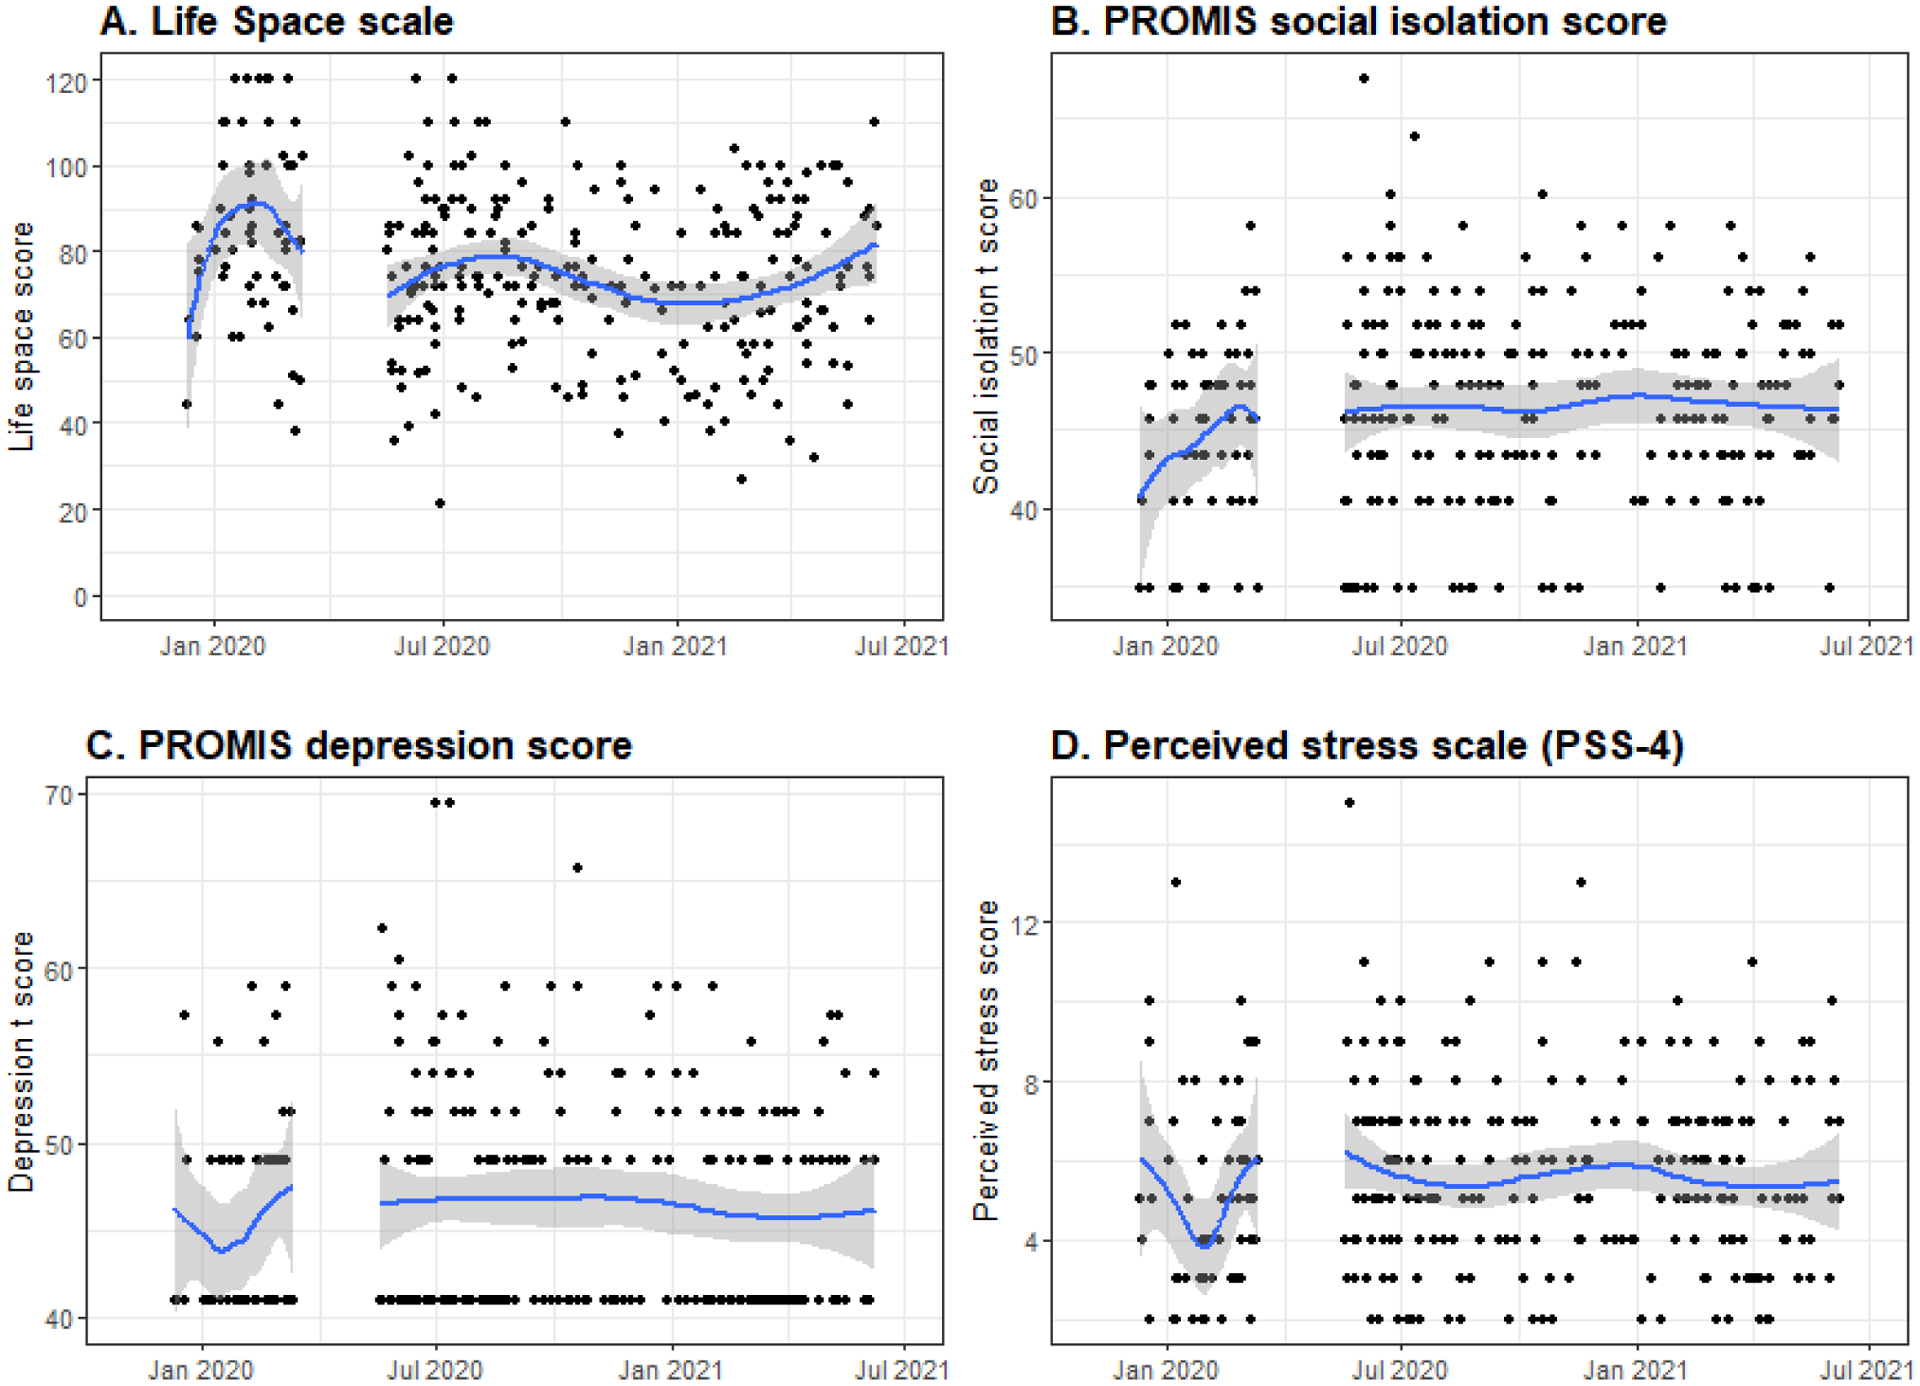
Figure 3. Participant scores over time (n=16 pre-COVID; n=167 during COVID-19).

Lines represent scale score, with 95% confidence intervals. All PROMIS scores are analyzed as standardized T-scores.

Lines represent scale score, with 95% confidence intervals. All PROMIS scores are analyzed as standardized T-scores.