
Figure 1: scCUT&Tag-pro enables simultaneous profiling of CUT&Tag and protein levels.
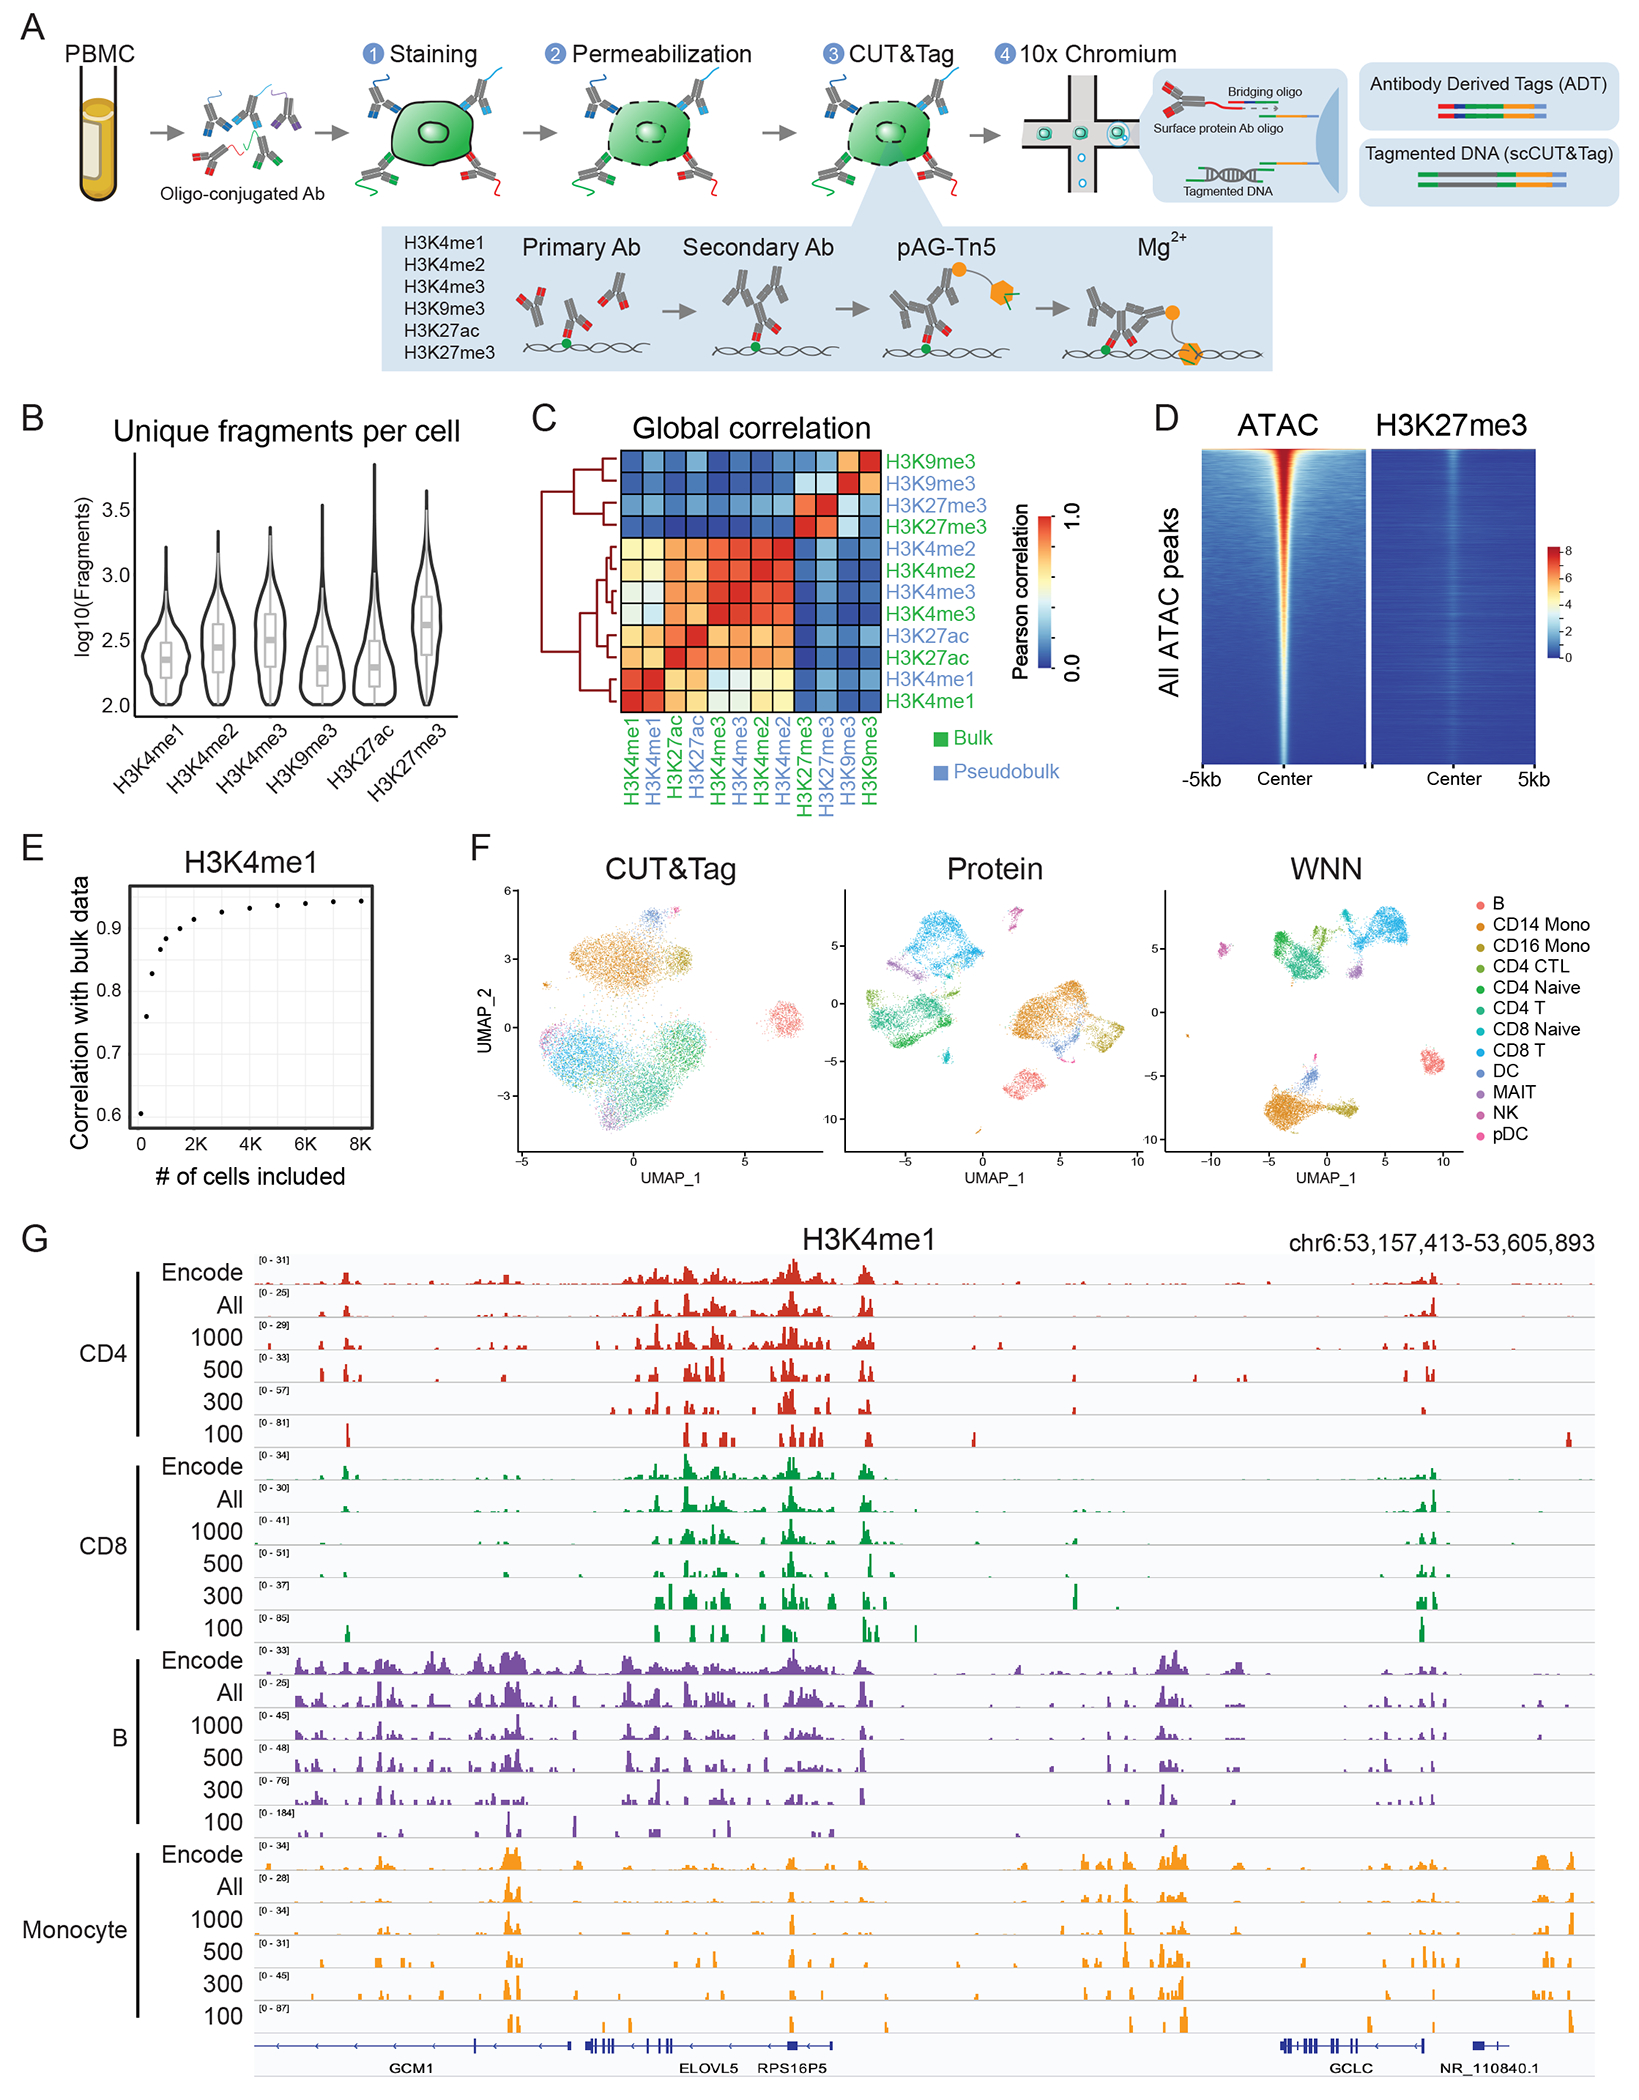
(A) Schematic of experimental workflow, which is compatible with the 10x Chromium system. (B) Distribution of unique fragments obtained per-cell for six histone modifications, profiled in separate PBMC scCUT&Tag-pro experiments (left to right n = 12,770, 9,575, 10,386, 8,304, 15,609 and 8,232 cells). The center, bounds and whiskers of the boxplot show median, quartiles and data points that lie within 1.5× interquartile range of the lower and upper quartiles, respectively. Data beyond the end of the whiskers are plotted individually. (C) Pseudobulk profiles of scCUT&Tag are well-correlated with bulk CUT&Tag profiles of human PBMC. (D) Tornado plots of genomic regions ordered by chromatin accessibility. We observe no enrichment of H3K27me3 in accessible regions, indicating minimal open chromatin bias. (E) Relationship between the number of cells included in a pseudobulk CUT&Tag profile of human PBMC, and the pearson correlation with a bulk experiment. (F) UMAP visualizations of 12,770 single cells profiled with H3K4me1 scCUT&Tag-pro and clustered on the basis of CUT&Tag profiles, cell surface protein levels, and weighted nearest neighbor (WNN) analysis which combines both modalities. Cluster labels are derived from WNN analysis. (G) Comparing pseudobulk CUT&Tag-pro profiles with ChIP-seq data from ENCODE. Including all cells assigned to each cell type results in pseudobulk tracks that closely mirror ENCODE profiles. However, even when downsampling to 300 cells per cluster, cell type-specific patterns can still be observed