
Figure 2: Protein measurements facilitate integrated analysis across modalities.
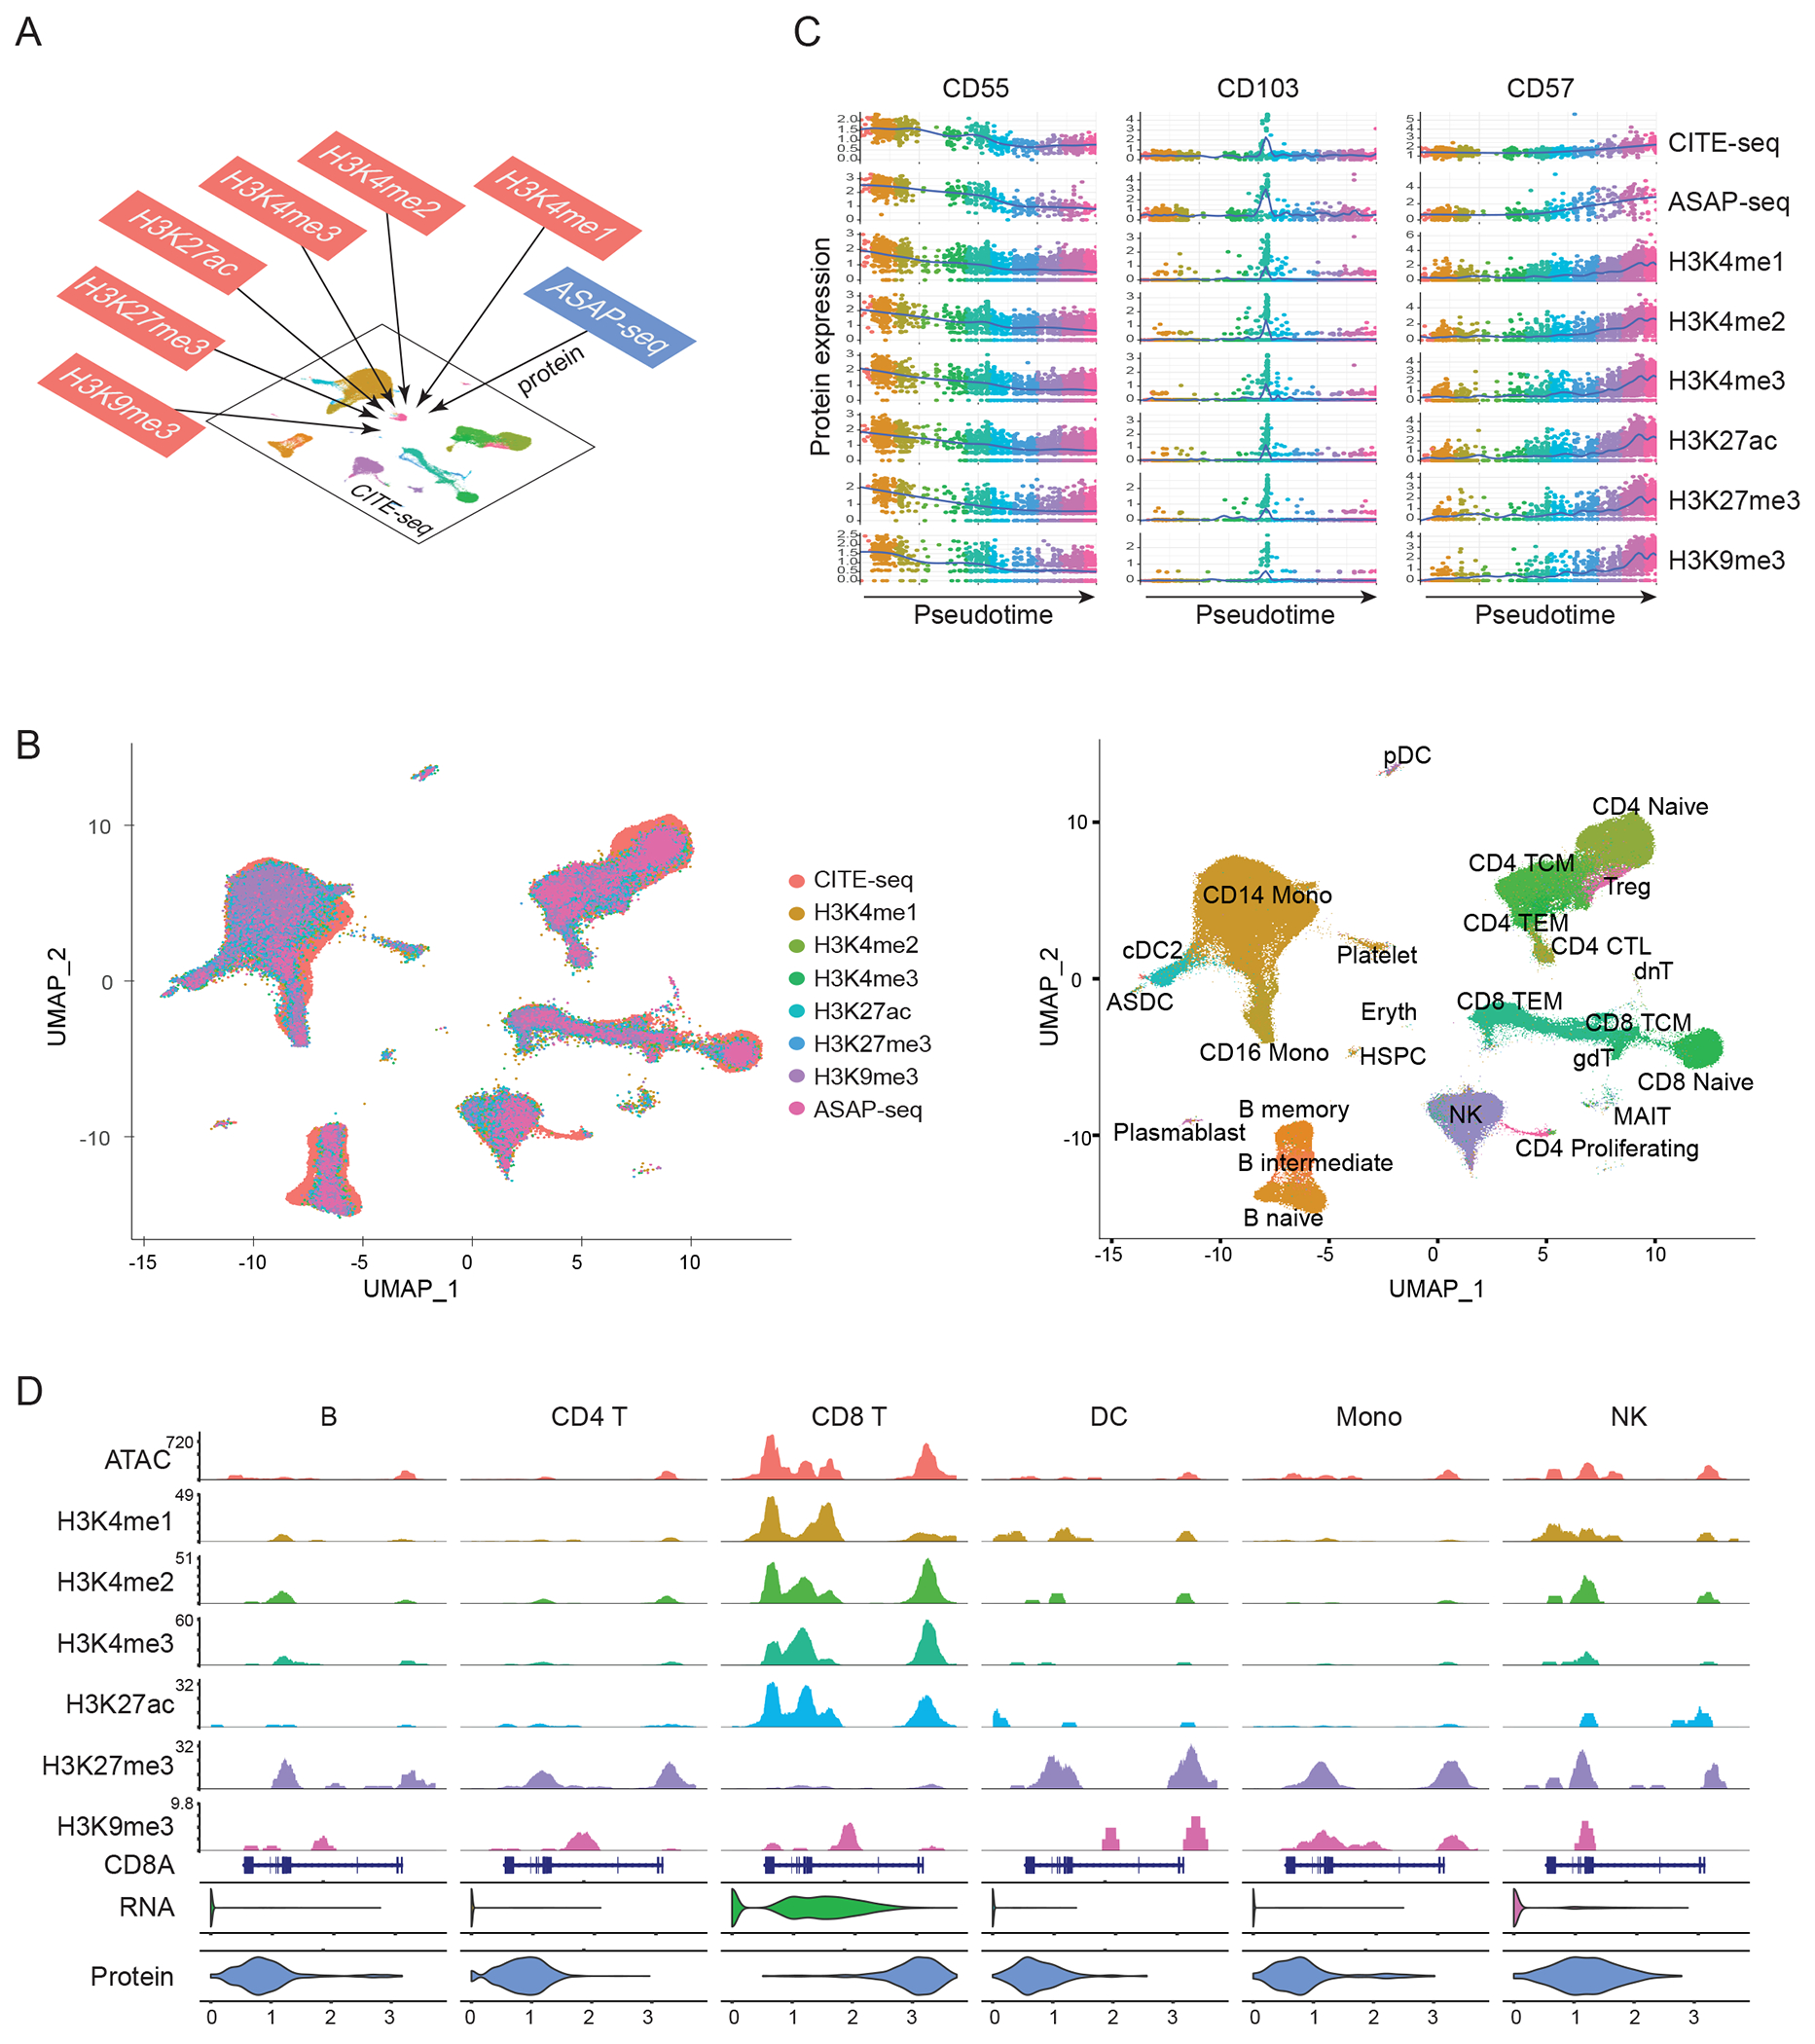
(A) Schematic workflow for integrated analysis. Datasets produced by scCUT&Tag-pro, ASAP-seq, and CITE-seq are integrated together on the basis of a shared panel of cell surface protein measurements. (B) Left: UMAP visualization of 230,597 total cells projected onto the reference dataset from (Hao et al, Cell 2021). Right: In addition to a harmonized visualization, cells from all experiments are annotated with a unified set of labels. (C) We learned a unified pseudotime trajectory based on all experiments, representing the CD8 T cell transition from naive to effector states. We observe identical molecular dynamics for naive (CD55), memory (CD103), and effector (CD57) markers across all experiments, demonstrating that integrative analysis accurately identifies cells in matched biological states across experiments. (D) Visualization of nine molecular modalities at the CD8A locus in B cell (B), CD4 T cell (CD4 T), CD8 T cell (CD8 T), dendritic cell (DC), monocyte (Mono) and natural killer cell (NK) groups.