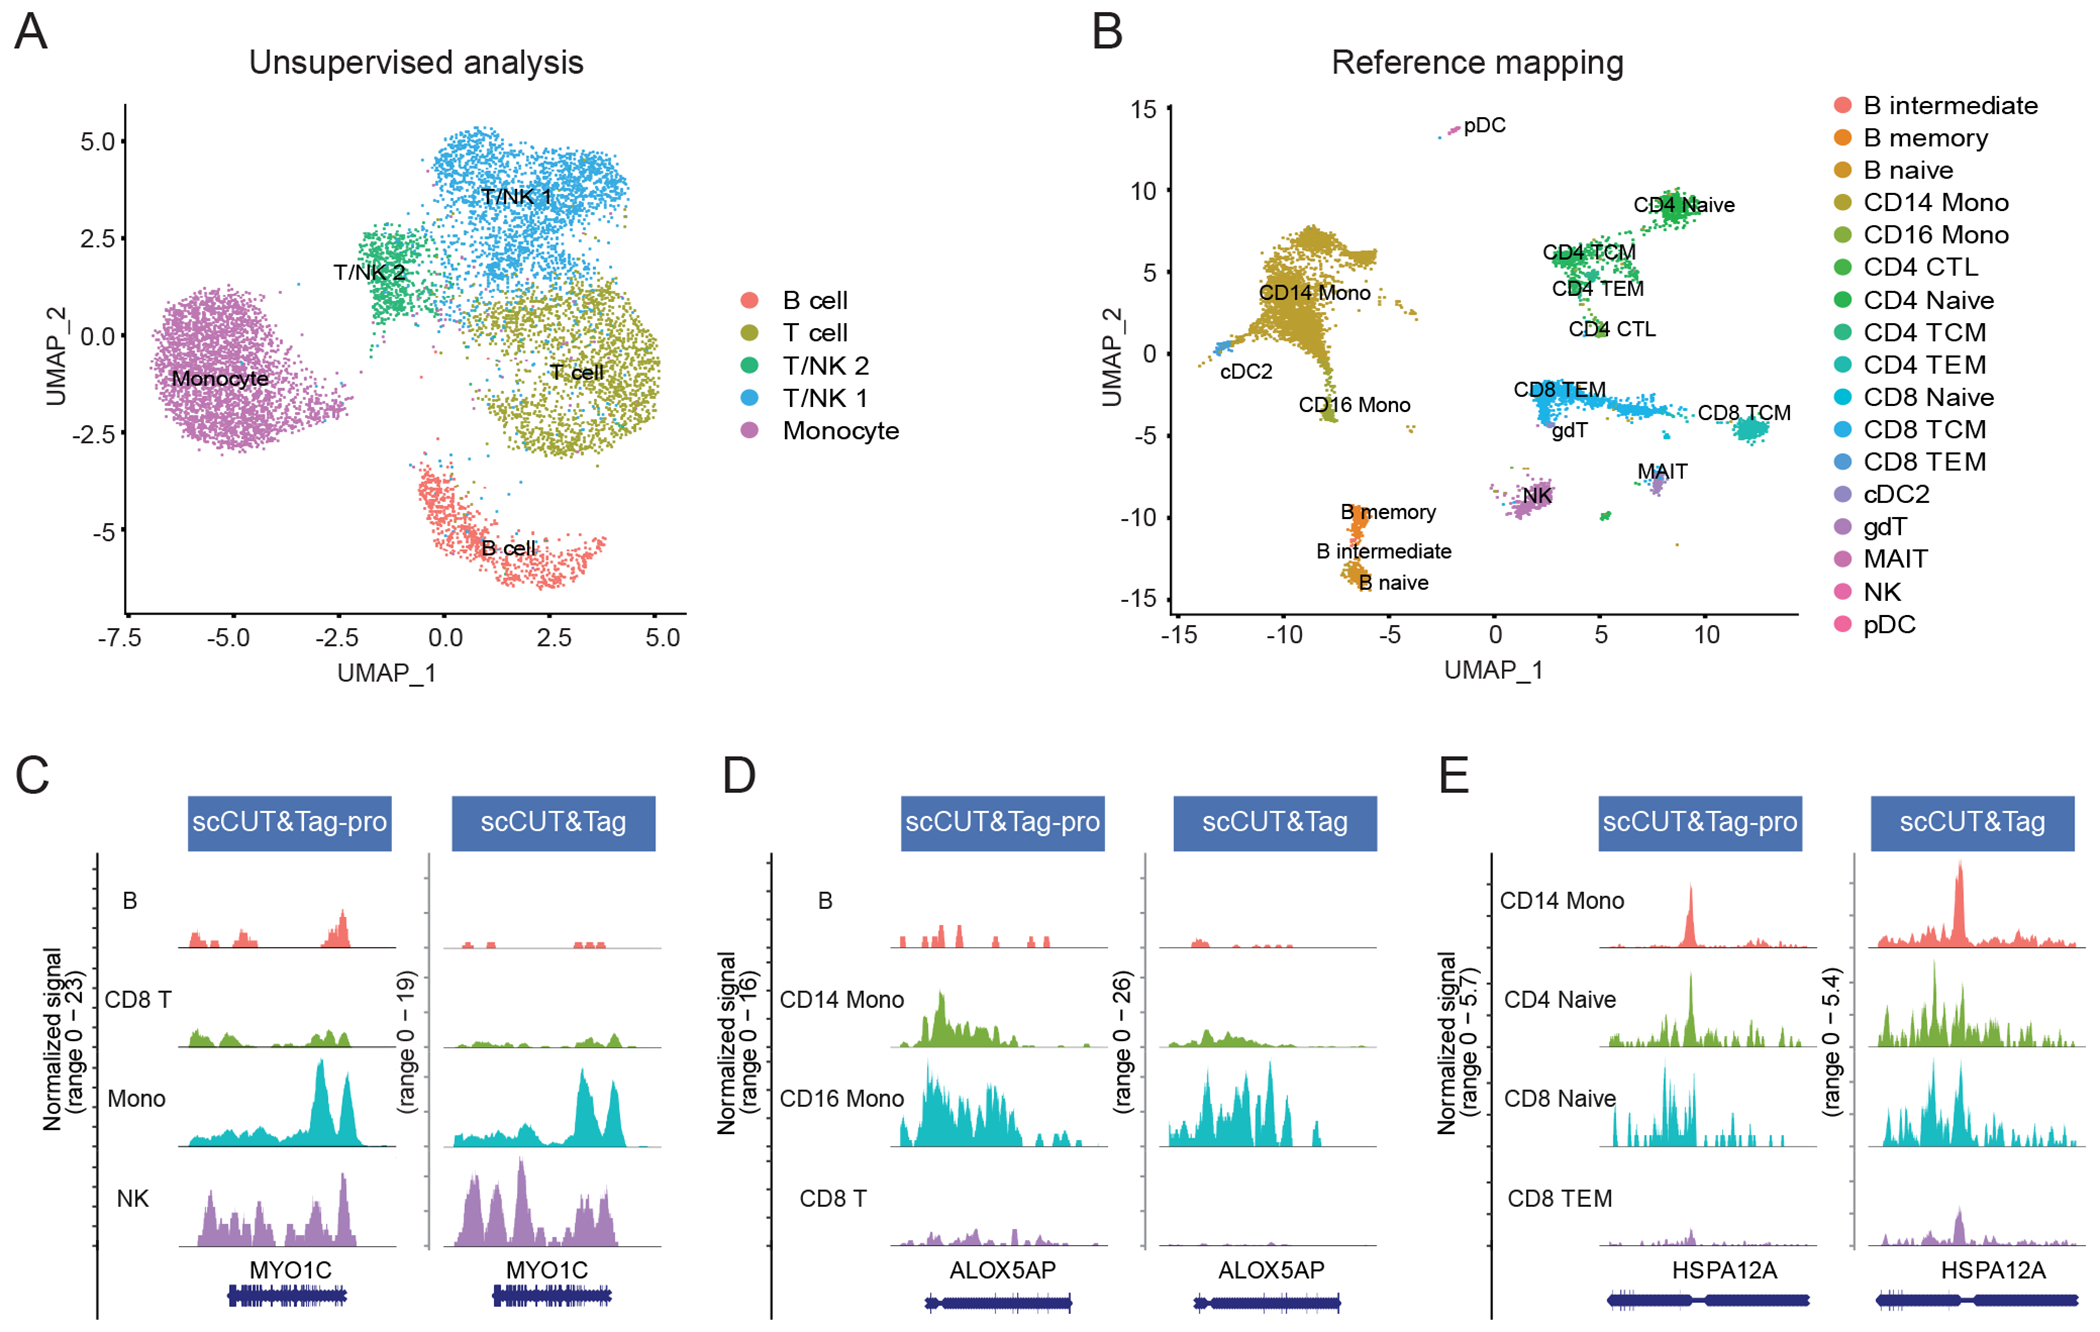
Figure 5: Supervised mapping of scCUT&Tag datasets.

(A) UMAP visualization of 8,362 H3K27me3 scCUT&Tag profiles of human PBMC, from (Wu et al, 2021), based on an unsupervised analysis and clustering. (B) Same cells as in (A), but after mapping to the multimodal reference defined in this paper. Cells are colored by their reference-derived level 2 annotations. (C)-(E) Coverage plots showing the cell type-specific binding patterns of H3K27me3 at three loci. Plots are shown for our dataset (reference), as well as the scCUT&Tag profiles from the query dataset (query, Wu et al, 2021). Cells in the query dataset are grouped by their predicted labels. We observe highly concordant patterns across datasets for all loci, supporting the accuracy of our predictions. Four representative cell types are shown at each locus. TEM: T effector memory.
