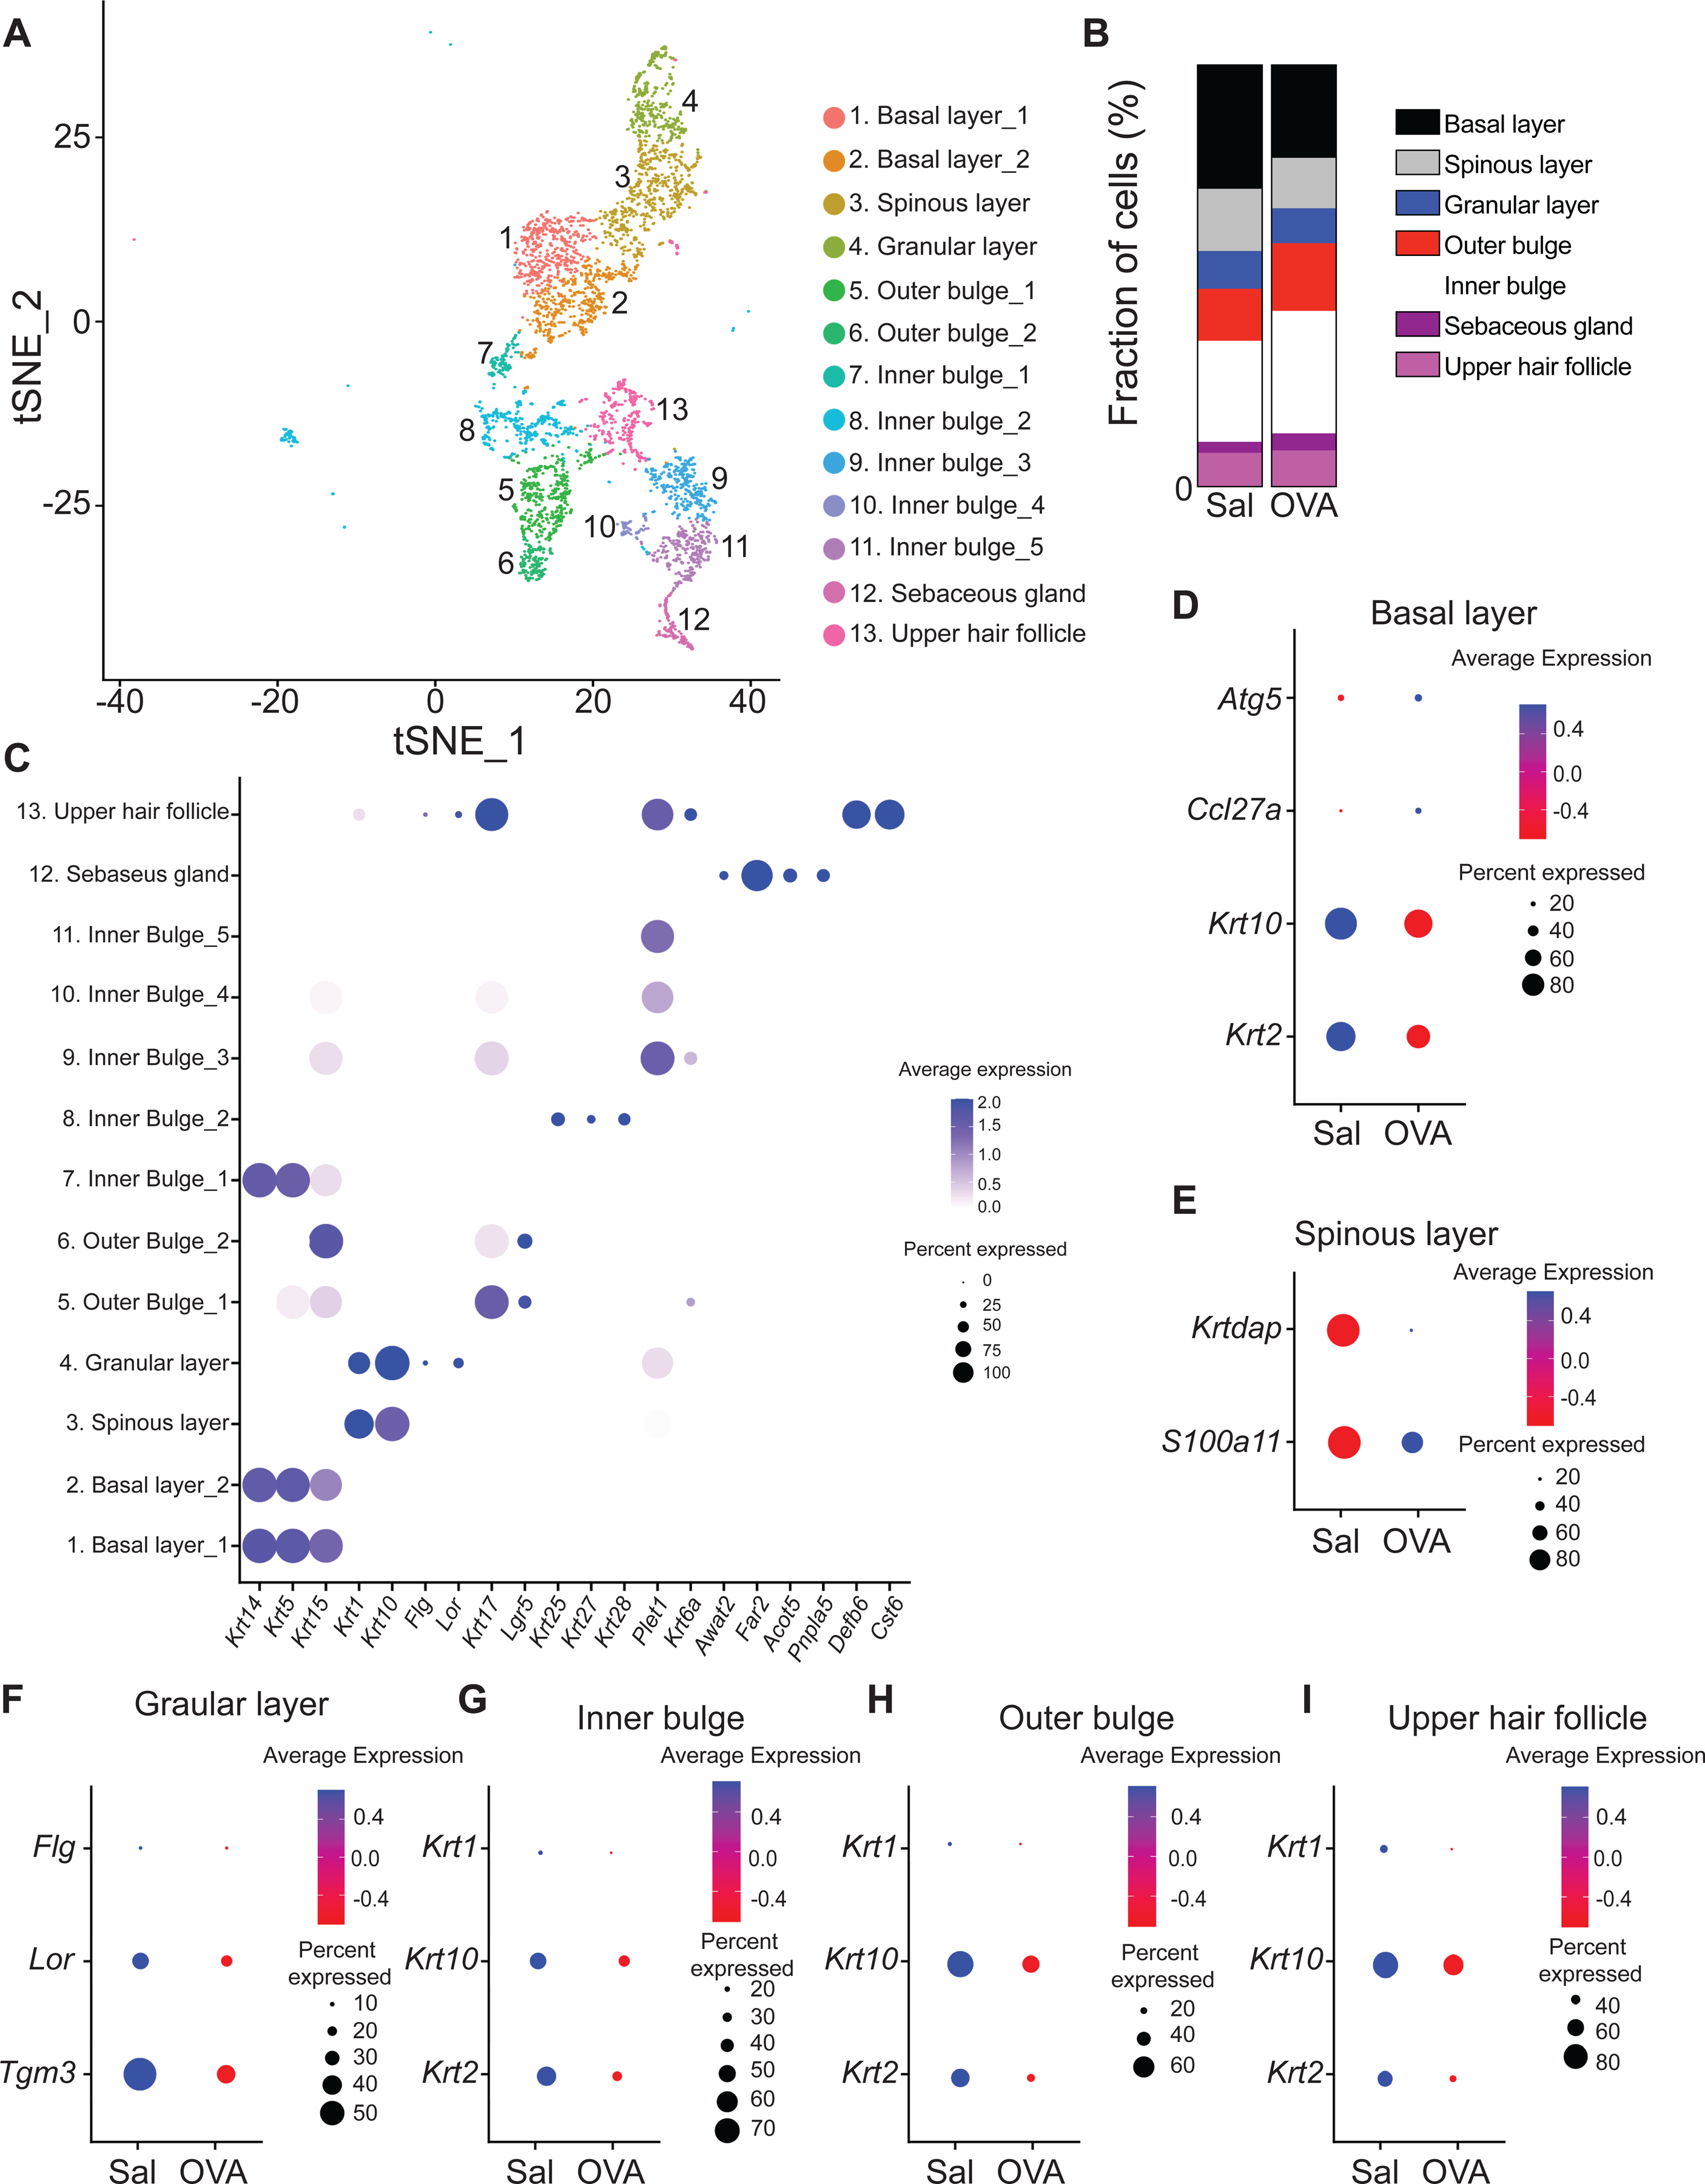
Figure 3. Characterization of the keratinocyte population in mouse EC sensitized skin by scRNA-Seq.

A. t-Distributed stochastic neighbor embedding plot for keratinocyte cluster from EC sensitized mouse skin, revealing 13 clusters. B. Distribution of keratinocyte populations identified in mouse skin EC sensitized with OVA or saline. C. Dot plot displaying top expressed genes in each keratinocyte cluster. D-I. Dot plot of differentially expressed genes in the keratinocyte basal layer (D), spinous layer (E), granular layer (F), inner bulge (G), outer bulge (H) and upper hair follicle (I) clusters from skin EC sensitized with saline or OVA.
