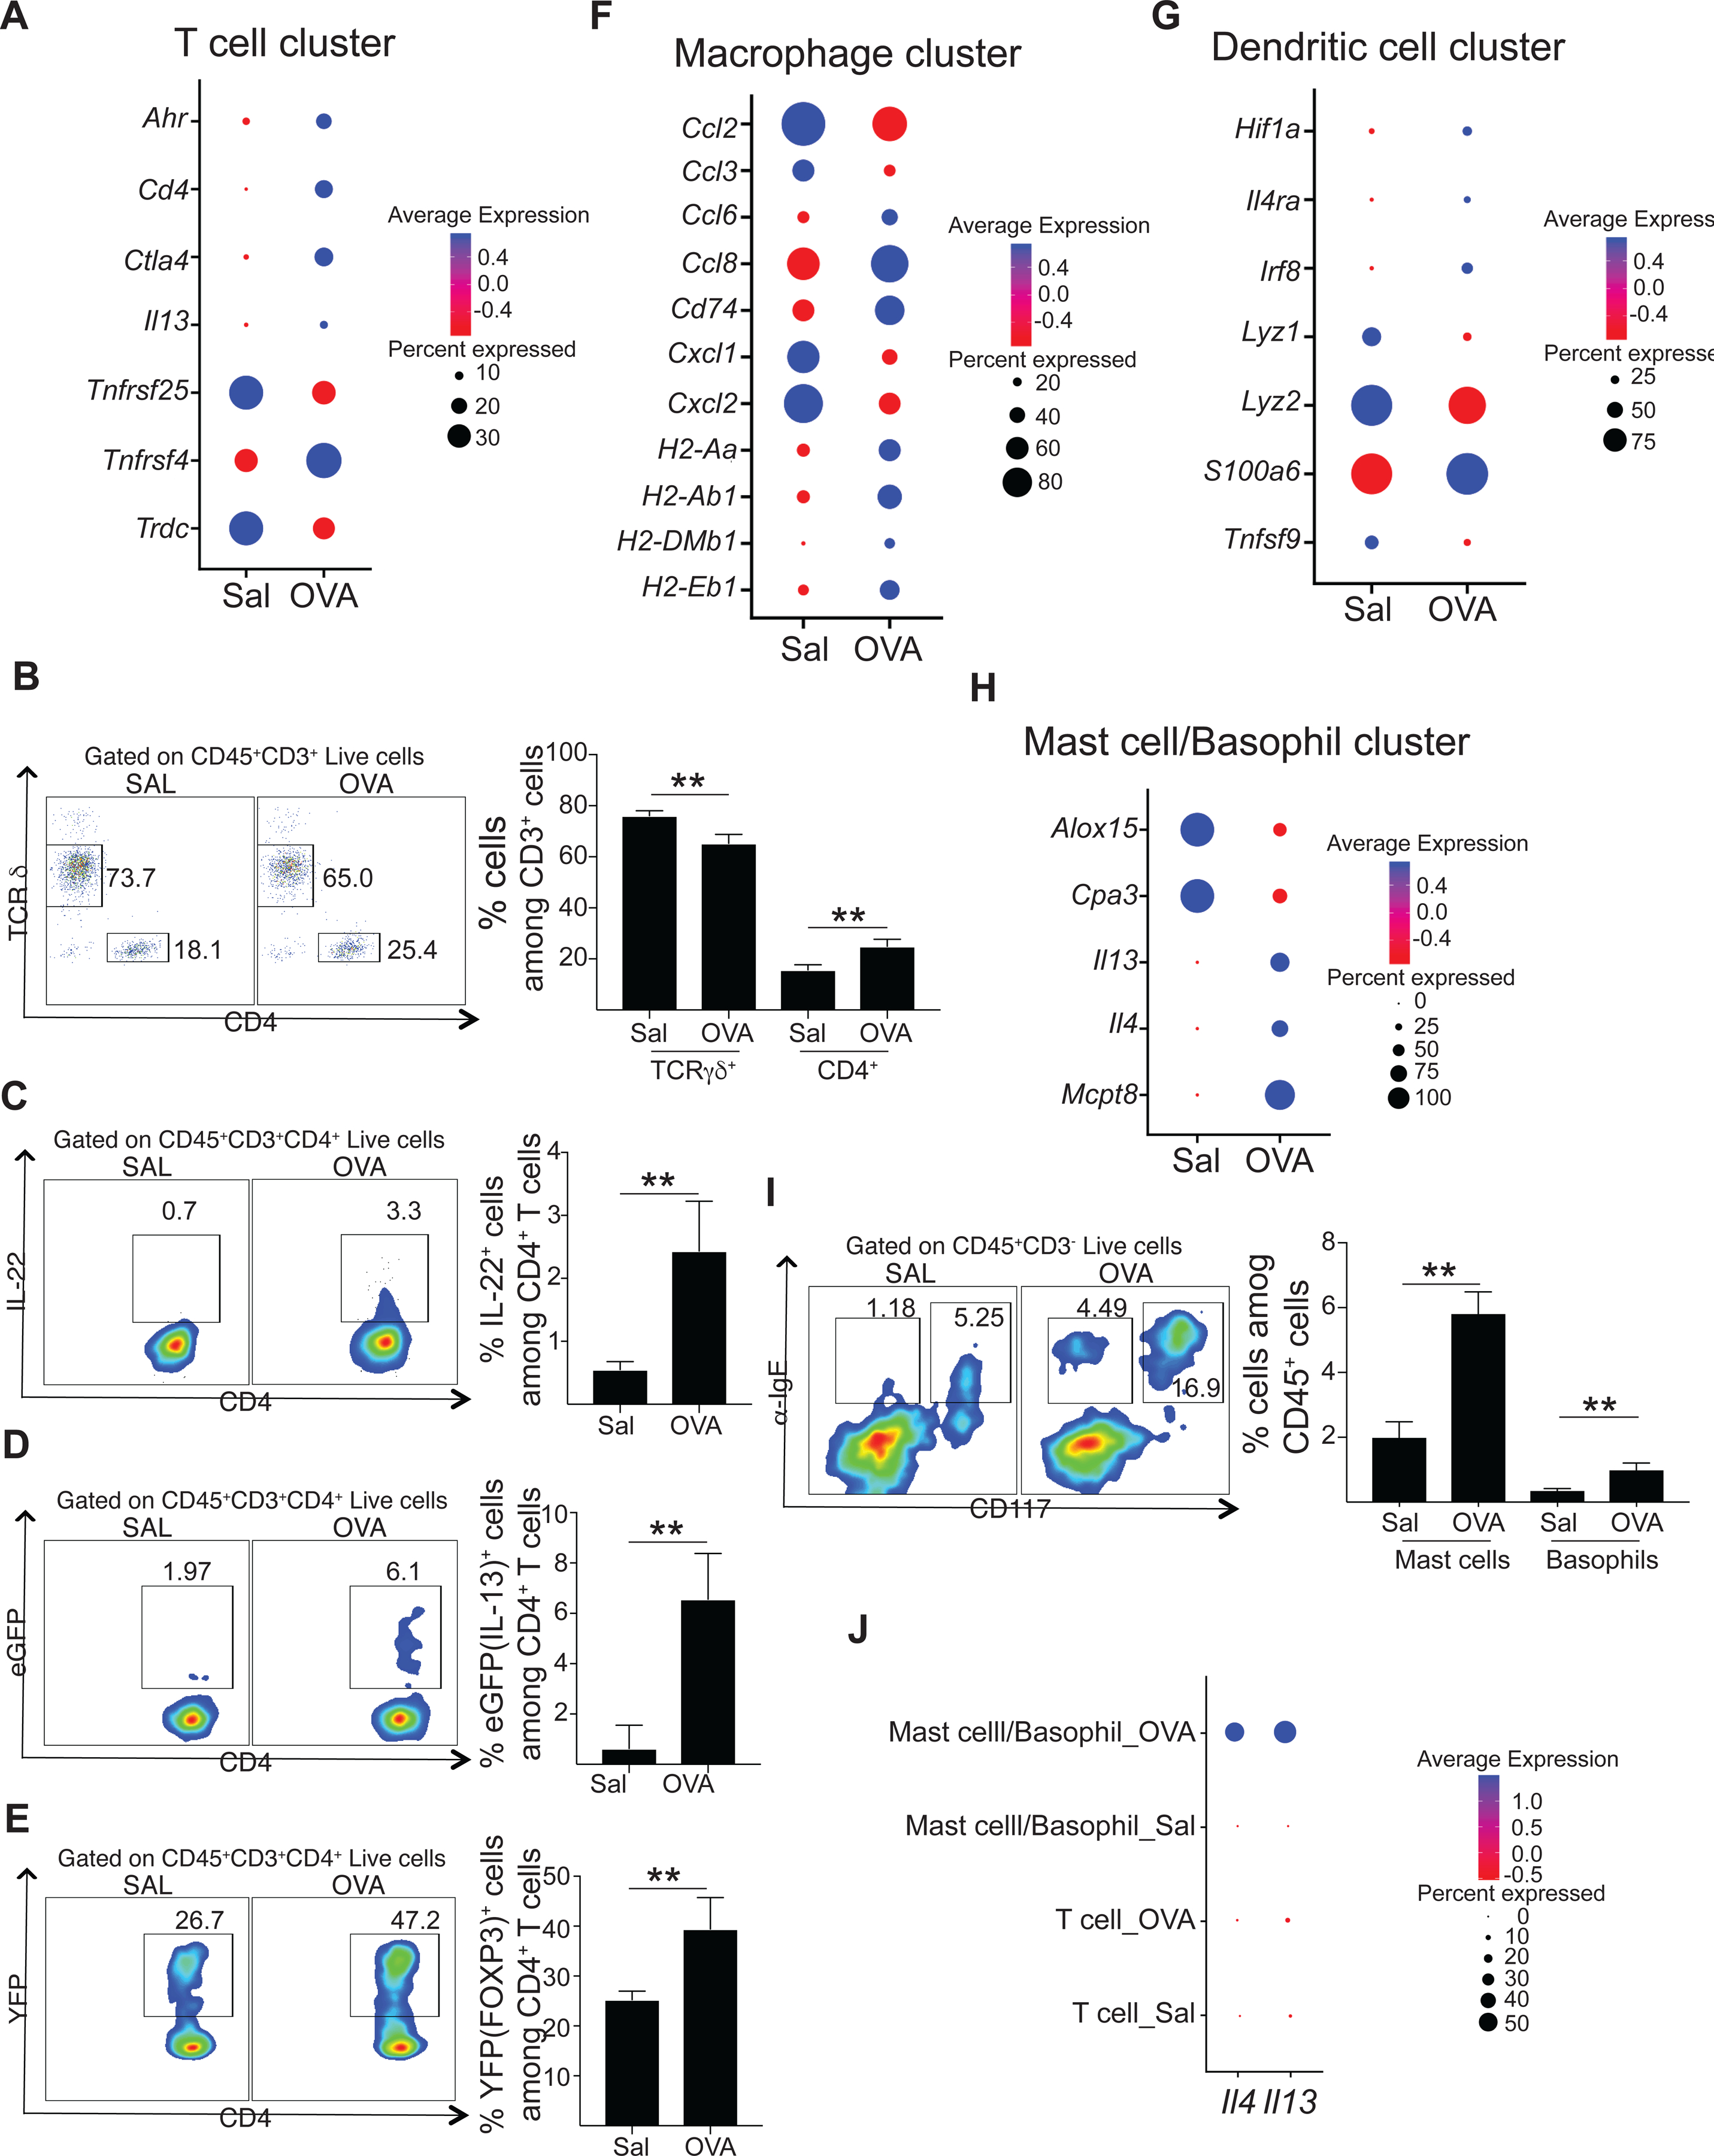
Figure 5. Characterization of immune cell populations in mouse EC sensitized skin by scRNA-Seq.

A. Dot plot of differentially expressed genes in T cell cluster of skin EC sensitized with saline or OVA. B-E. Representative flow cytometry plots (left) and percentages of CD4+ T cells and TCR γδ + T cells (B), CD4+ IL-22+ T cells (C), CD4+eGFP(IL-13)+ T cells (D) and CD4+YFP(FOXP3)+ T cells (E) of skin EC sensitized with saline or OVA. F-H. Dot plot of differentially expressed genes in DC (F), macrophages (G) and mast cell/basophil (H) clusters of skin EC sensitized with saline or OVA. H. Representative flow cytometry plots (left) and percentages of mast cells and basophils of skin EC sensitized with saline or OVA. I. Dot plot displaying the relative Il4 and Il13 expression in the T cell cluster and the mast cell/basophil cluster from skin EC sensitized with saline or OVA.
