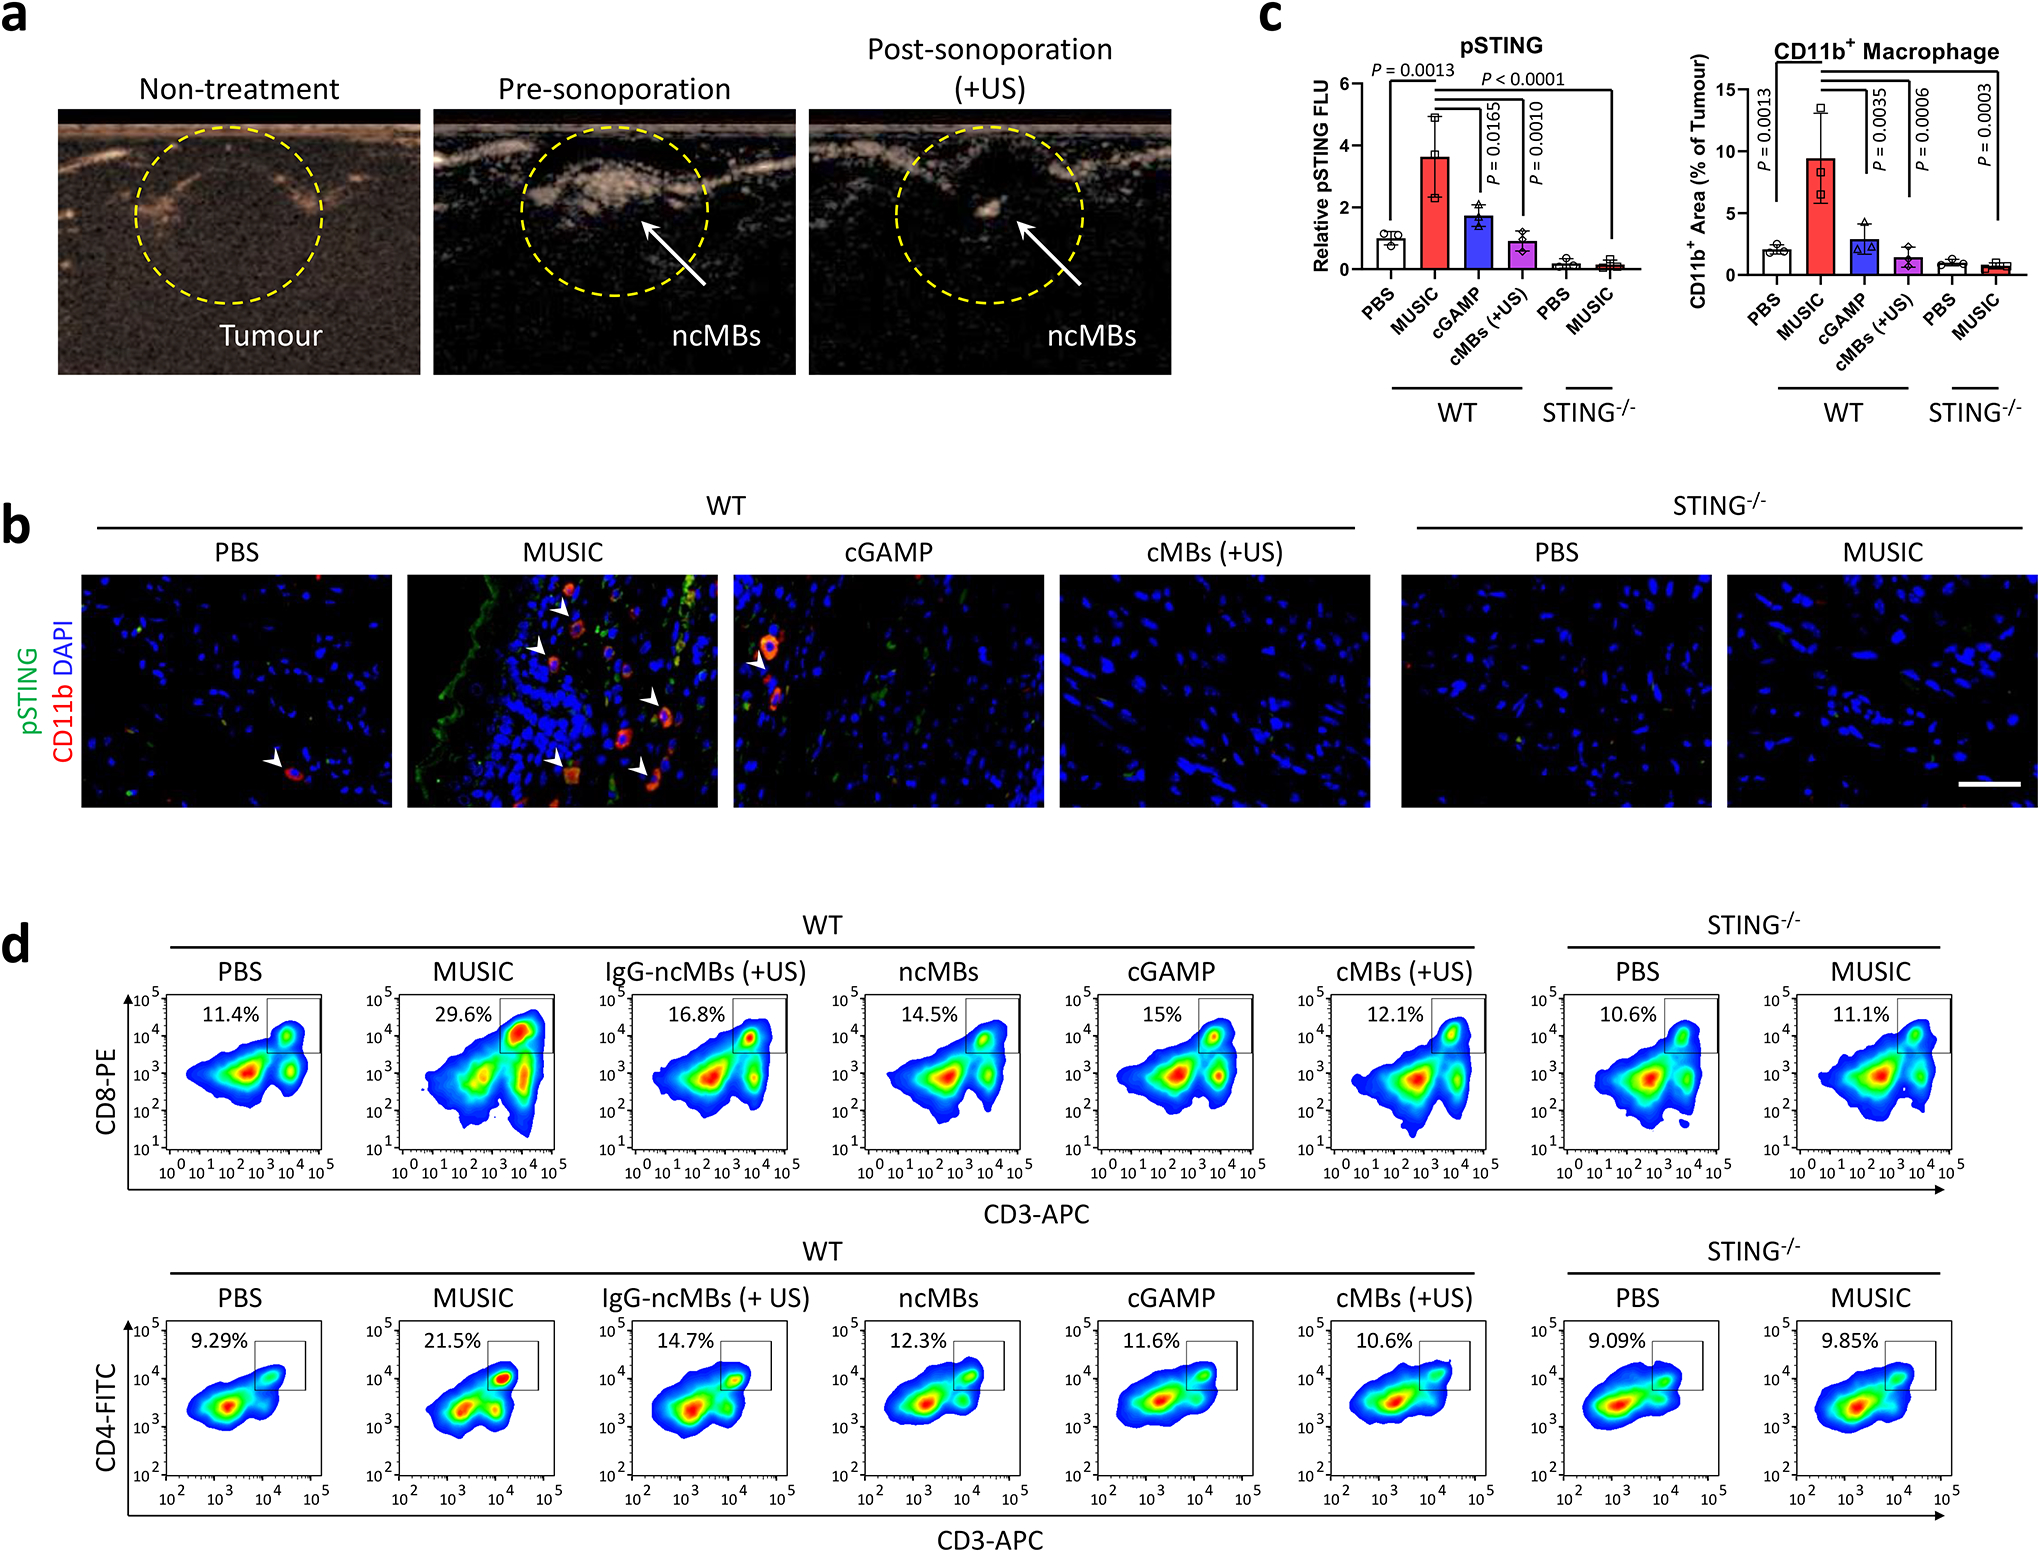
Fig. 3 |. MUSIC activates STING signaling and T cell response in primary breast cancer in vivo.

a, Contrast mode ultrasound (US) images of EO771 breast tumours (13 days) in C57BL/6J mice before ncMBs injection (left, Non-treatment), after ncMBs injection (middle, Pre-sonoporation), and after US sonoporation (right, Post-sonoporation). Loss in signal represents bubbles being destroyed after exposure to US. Images are from the same mouse and is representative of 5 randomly treated wild-type (WT) mice. b-d, WT and STING−/− mice were inoculated with EO771 breast tumours, and treated with MUSIC, cGAMP, or cMBs (+US) following the strategy in Supplementary Fig. 17a. b, At 18 days post tumour inoculation, immunostaining by confocal microscopy visualized recruited CD11b+ cells and pSTING+ cells in tumour paraffin section slides. Representative images from random fields of view in one of the three biologically independent mice. Scale bar=50 μm. c, Fluorescence intensity measurements and comparison by ImageJ software from three randomly selected images of three biologically independent mice, analysed by one-way ANOVA with Tukey’s multiple comparisons test. d, Flow cytometry analysis and quantification of CD8+ T or CD4+ T cells in tumours of representative mice at day 18 in each group. Data are representative from three biological independent samples (d) and are shown as mean ± s.d. (c), analysed by one-way ANOVA with Tukey’s multiple comparisons test (c).
