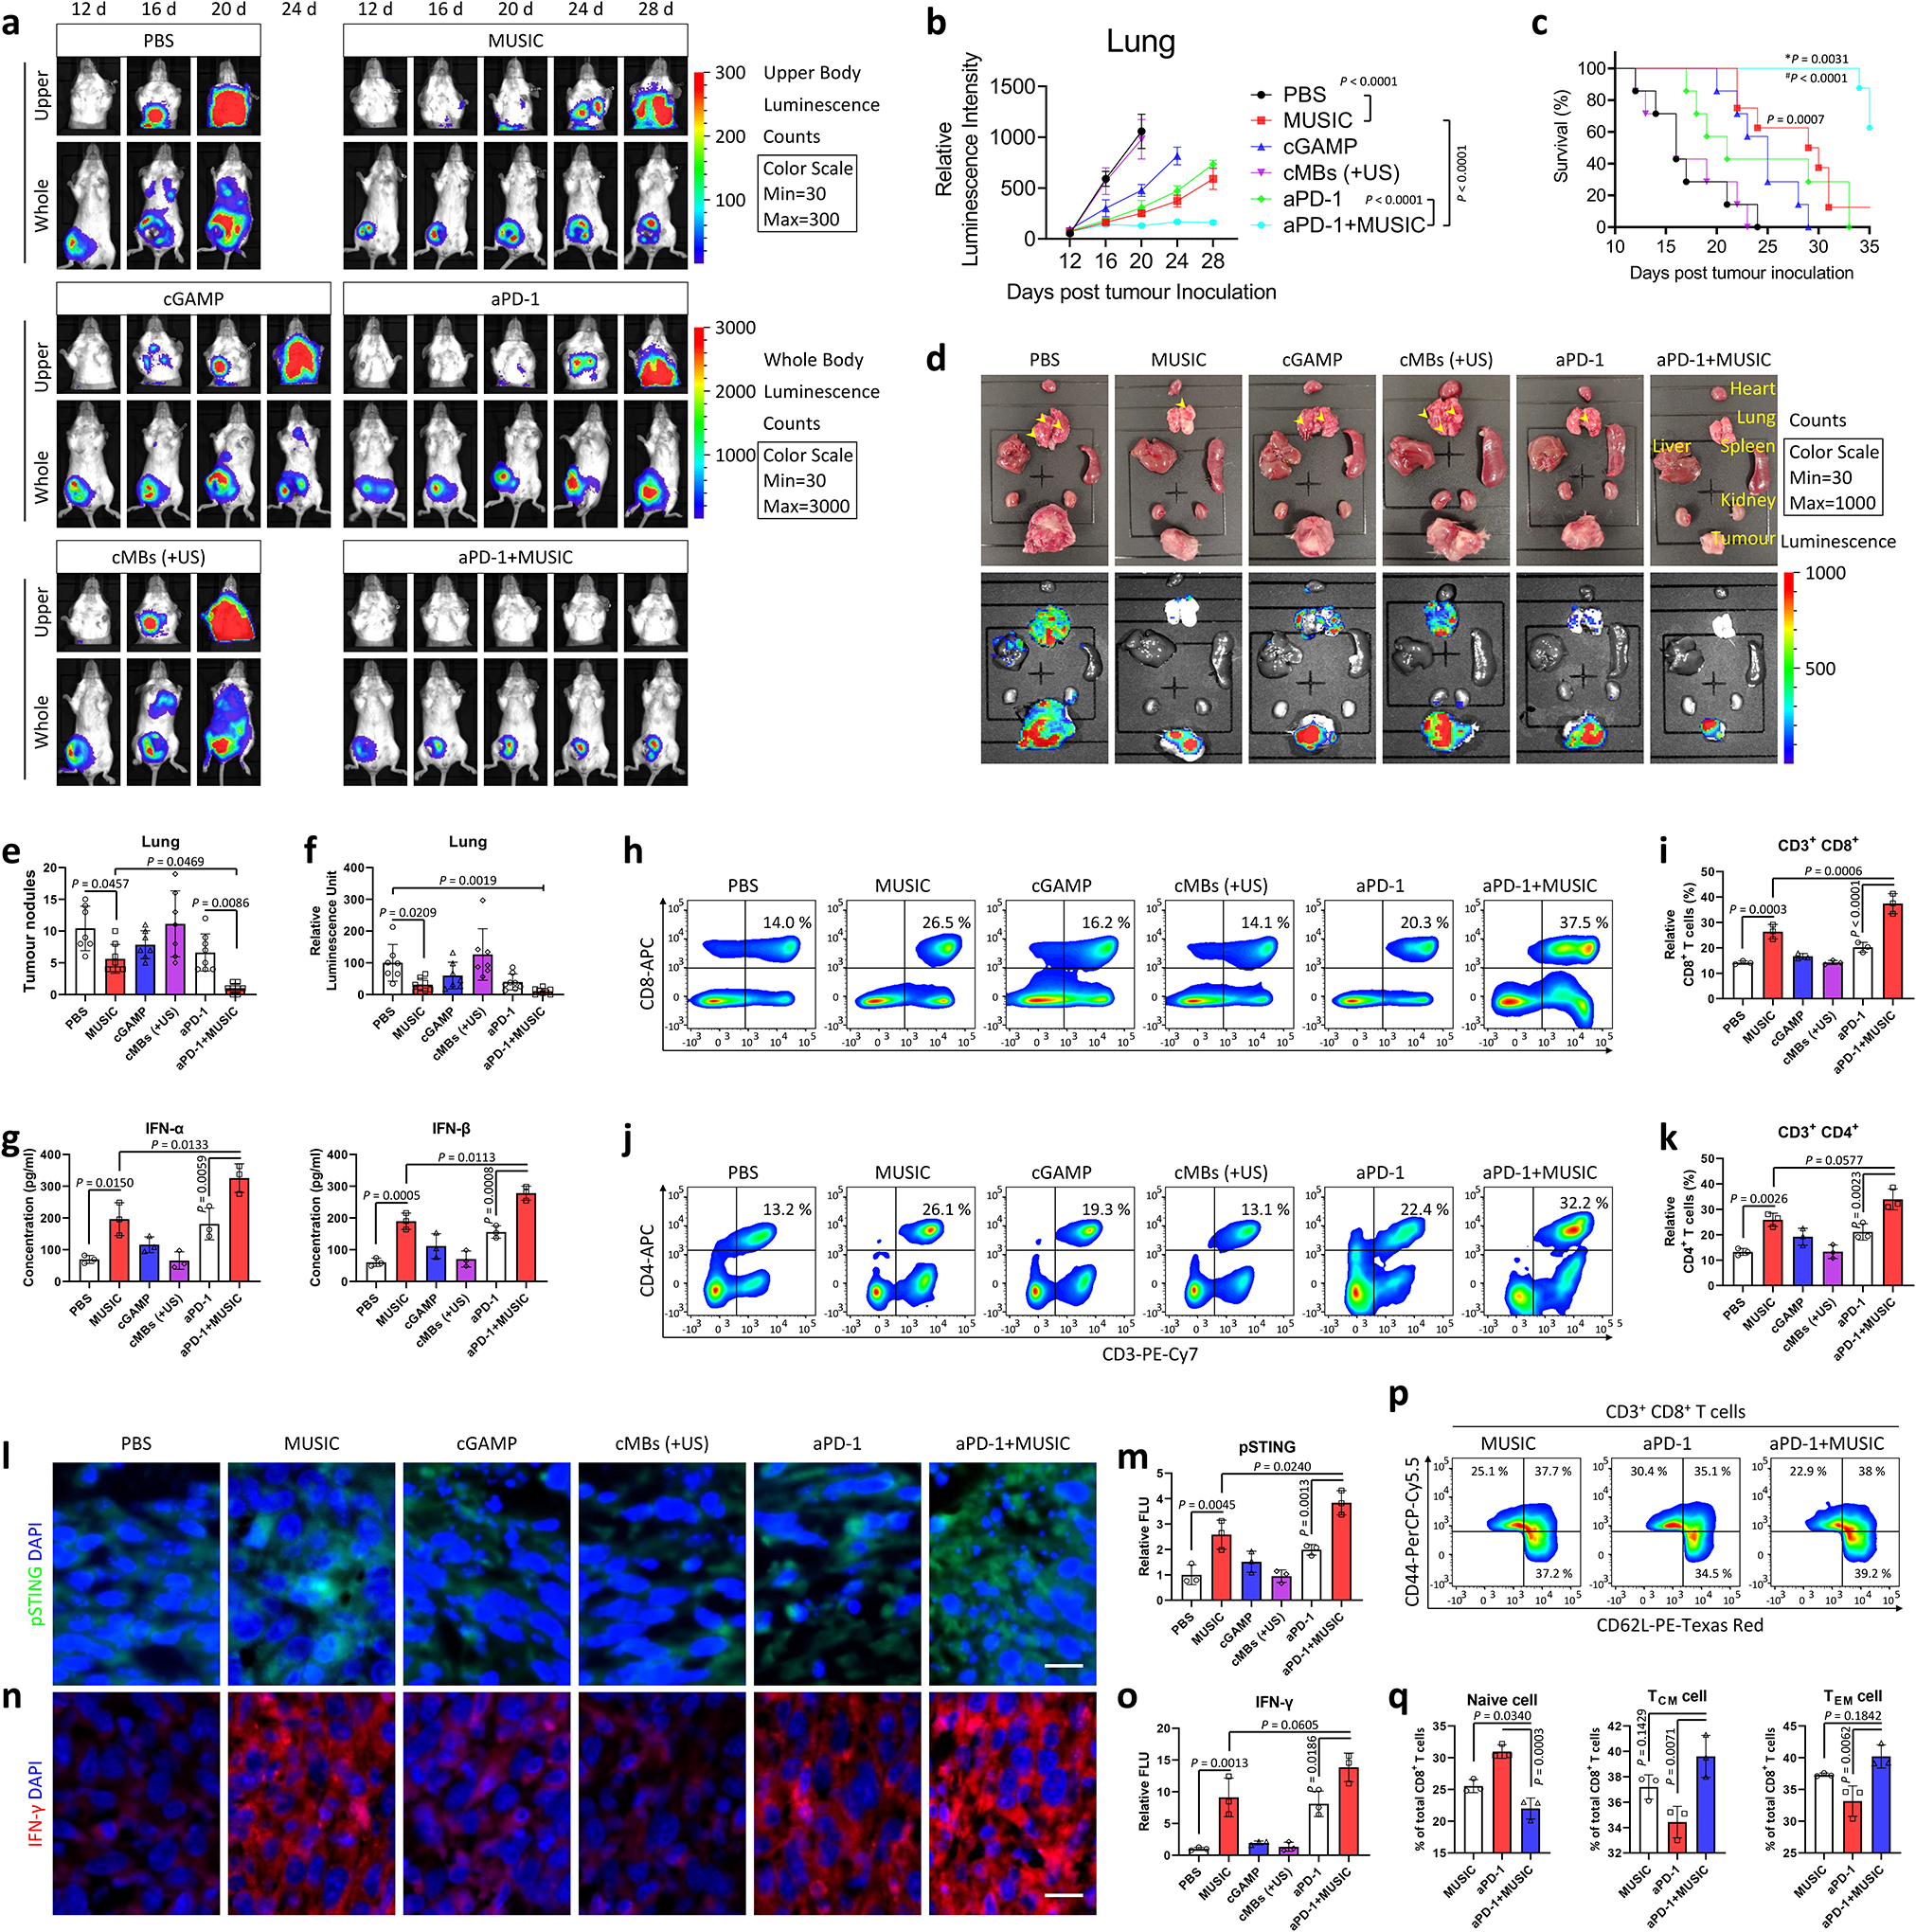
Fig. 5 |. MUSIC activates systemic anti-tumour immunity to inhibit breast cancer metastasis.

a-f, BALB/cJ mice were inoculated with luciferase-expressing 4T1 (Luc-4T1) tumours and treated as indicated in Supplementary Fig. 26a. n=7 for PBS, cGAMP, and cMBs (+US); n=8 for MUSIC, aPD-1, and aPD-1+MUSIC. Representative IVIS spectrum images (a) and quantified signal intensity (b) showing metastases of Luc-4T1 breast tumours at 28 days. c, Survival curves were plotted and analysed for the mice in each treatment arm. d, Representative photographs and bioluminescence images of organs ex vivo after euthanasia show the presence of tumour metastases. e, Quantification of tumour nodules in lungs from (d). f, Quantified bioluminescence signals in lungs from (d). g, Accumulation of IFN-α or IFN-β in tumours (determined using ELISA) at 21 days post tumour inoculation. h-k, Flow cytometry analysis and quantification of CD8+ T or CD4+ T cells in tumours at day 21 in each group. i,k Proportions of CD8+ or CD4+ T cells. l-o, Levels of activated (phosphorylated) STING and IFN-γ protein in tumour paraffin section slides detected by immunostaining. l,n, Images were collected in a blinded fashion and represent three biologically independent experiments. Scale bar=20 μm. m,o, Quantification and comparisons of fluorescence intensity using ImageJ software from three randomly selected images. p,q, Flow cytometry of tumour lymphocytes demonstrate that 4T1 tumour-bearing mice treated with aPD-1+MUSIC experienced a shift from naive to memory CD8+ T cells at 21 days post tumour inoculation. q, Proportions of CD62L+/− or CD44+/− T cells. The data represent mean ± s.e.m. (b) or mean ± s.d. (e-g,i,k,m,o,q) from representative experiments of three independent experiments with n=3 (g,i,k,m,o,q), analysed by two-sided log-rank (Mantel-Cox) test (c), or one-way ANOVA with Tukey’s multiple comparisons test (b,e,g,i,k,m,o,q), or one-way ANOVA with Dunnett’s multiple comparisons test, PBS group as control (f). P, *P, and #P in (c) denote the statistical significance relative to the MUSIC vs PBS group, aPD-1+MUSIC vs MUSIC group, or aPD-1+MUSIC vs aPD-1 group, respectively.
