
FIGURE 2.
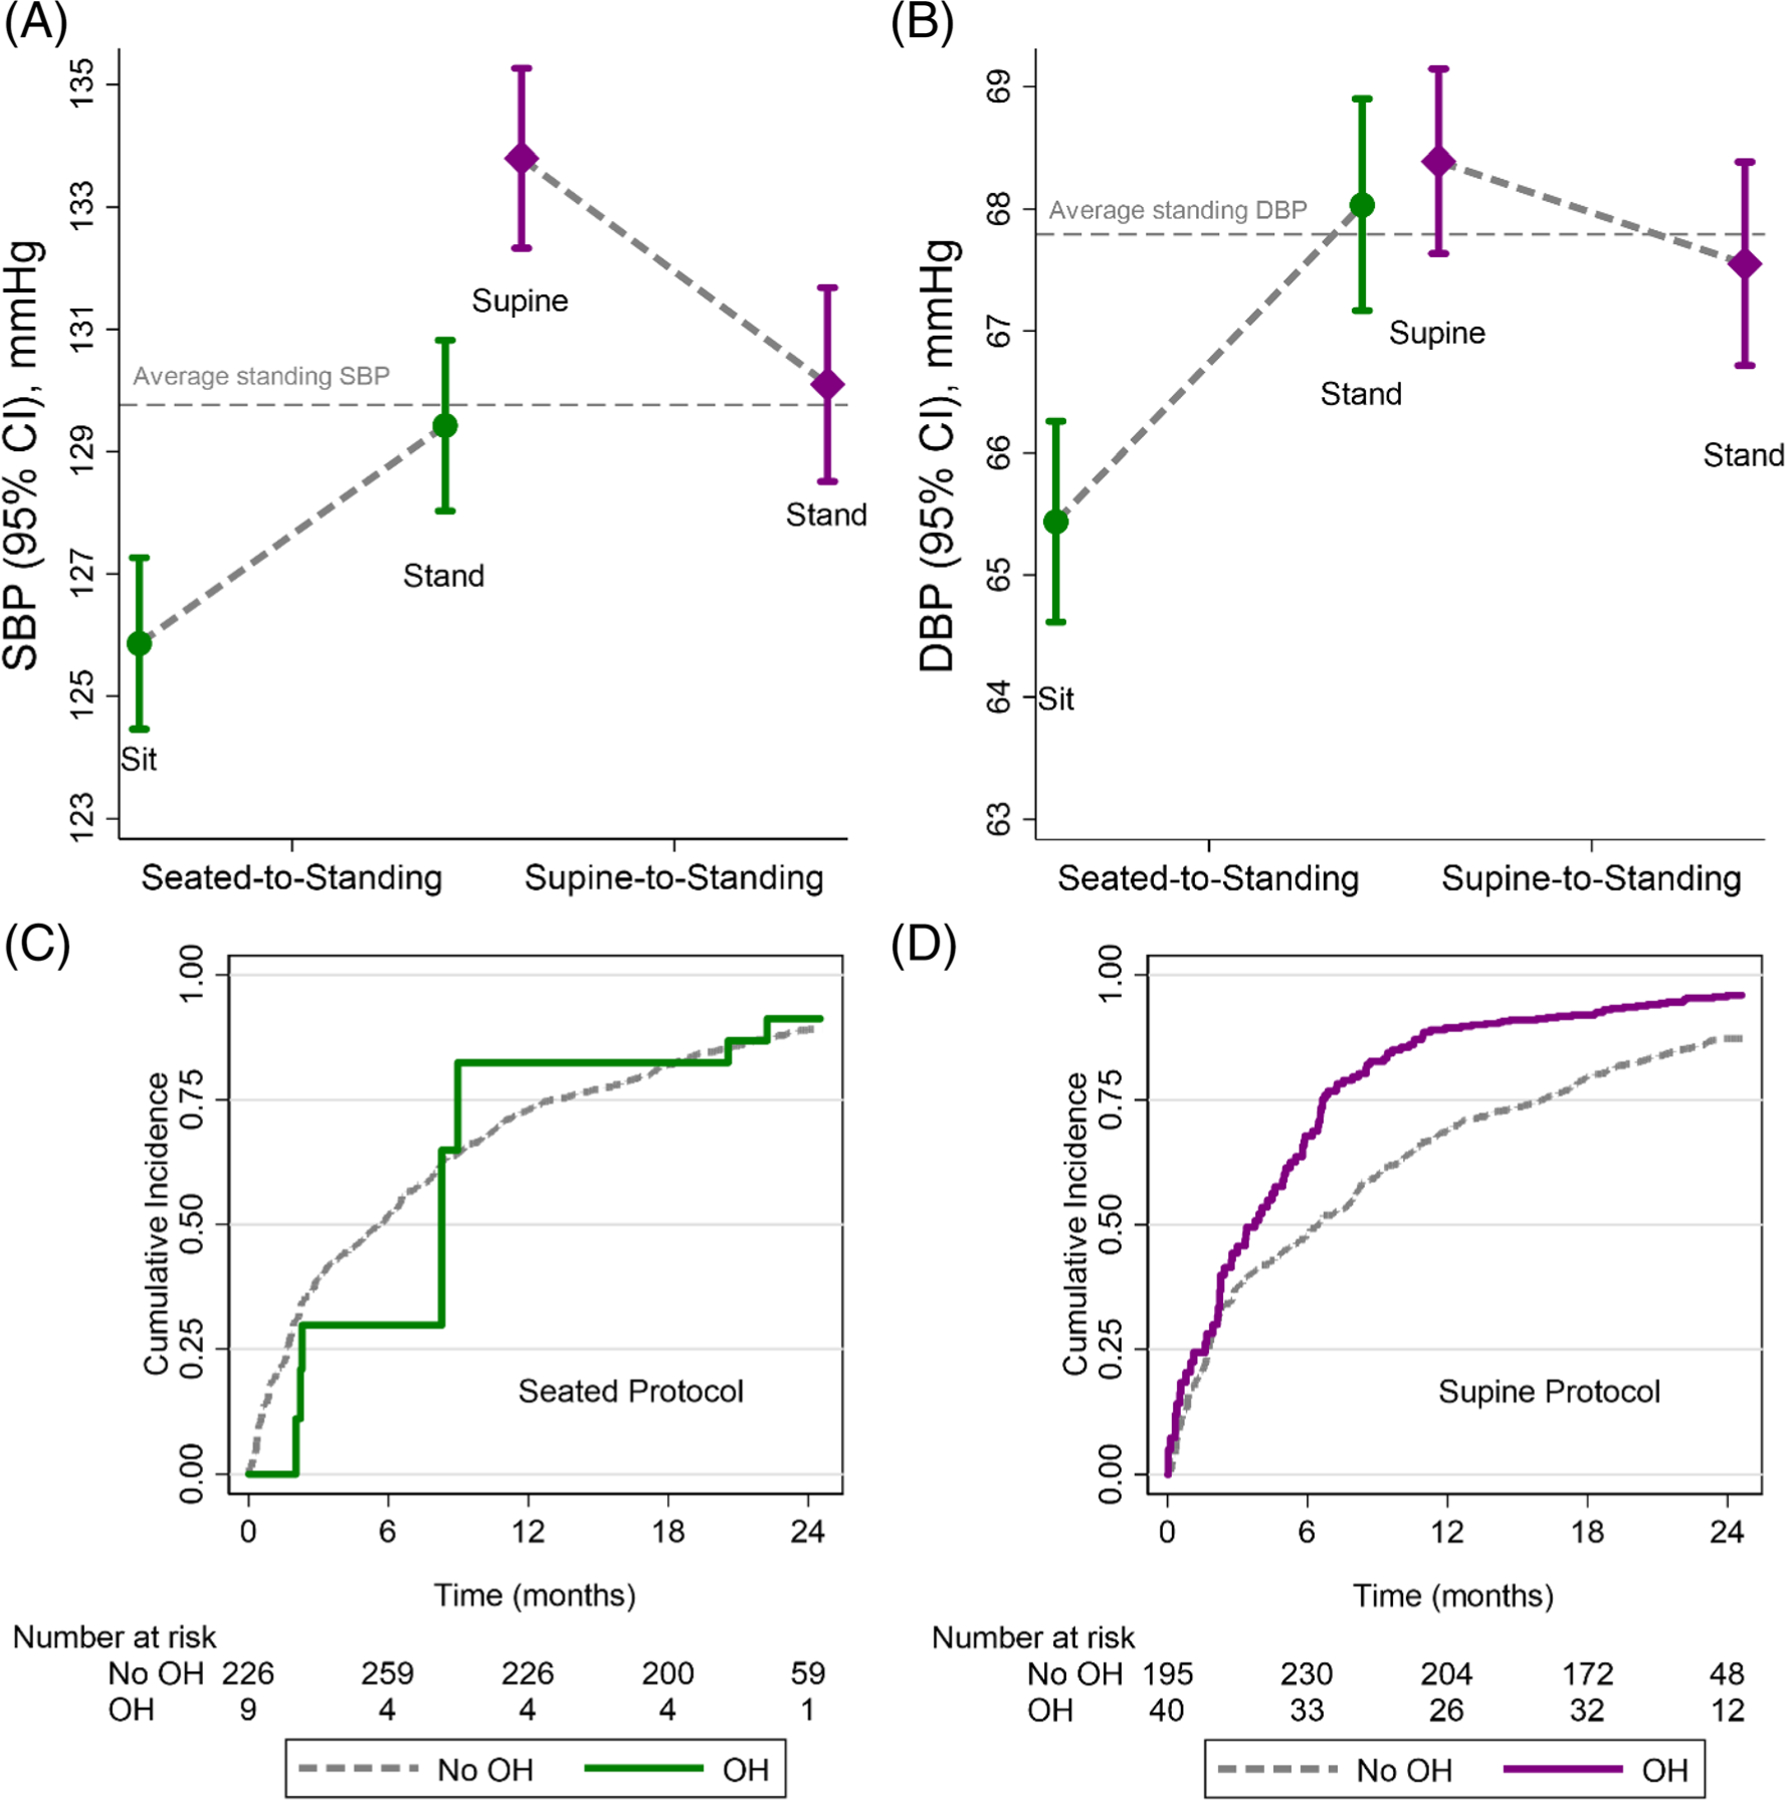
Mean (95% CI) (A) systolic blood pressure (SBP) and (B) diastolic blood pressure (DBP) in each position of the seated-tostanding or supine-to-standing protocols. The horizontal gray dashed line represents the mean standing blood pressure from both seated and supine protocols. Means were estimated using generalized estimating equations with a robust variance estimator. Cumulative incidence plots of the risk for recurrent fall events according to orthostatic hypotension status as a time-varying covariate identified using the (C) seated or (D) supine protocol. These plots are restricted to the population with both seated and supine protocols. Plots truncated at 750 days post-randomization