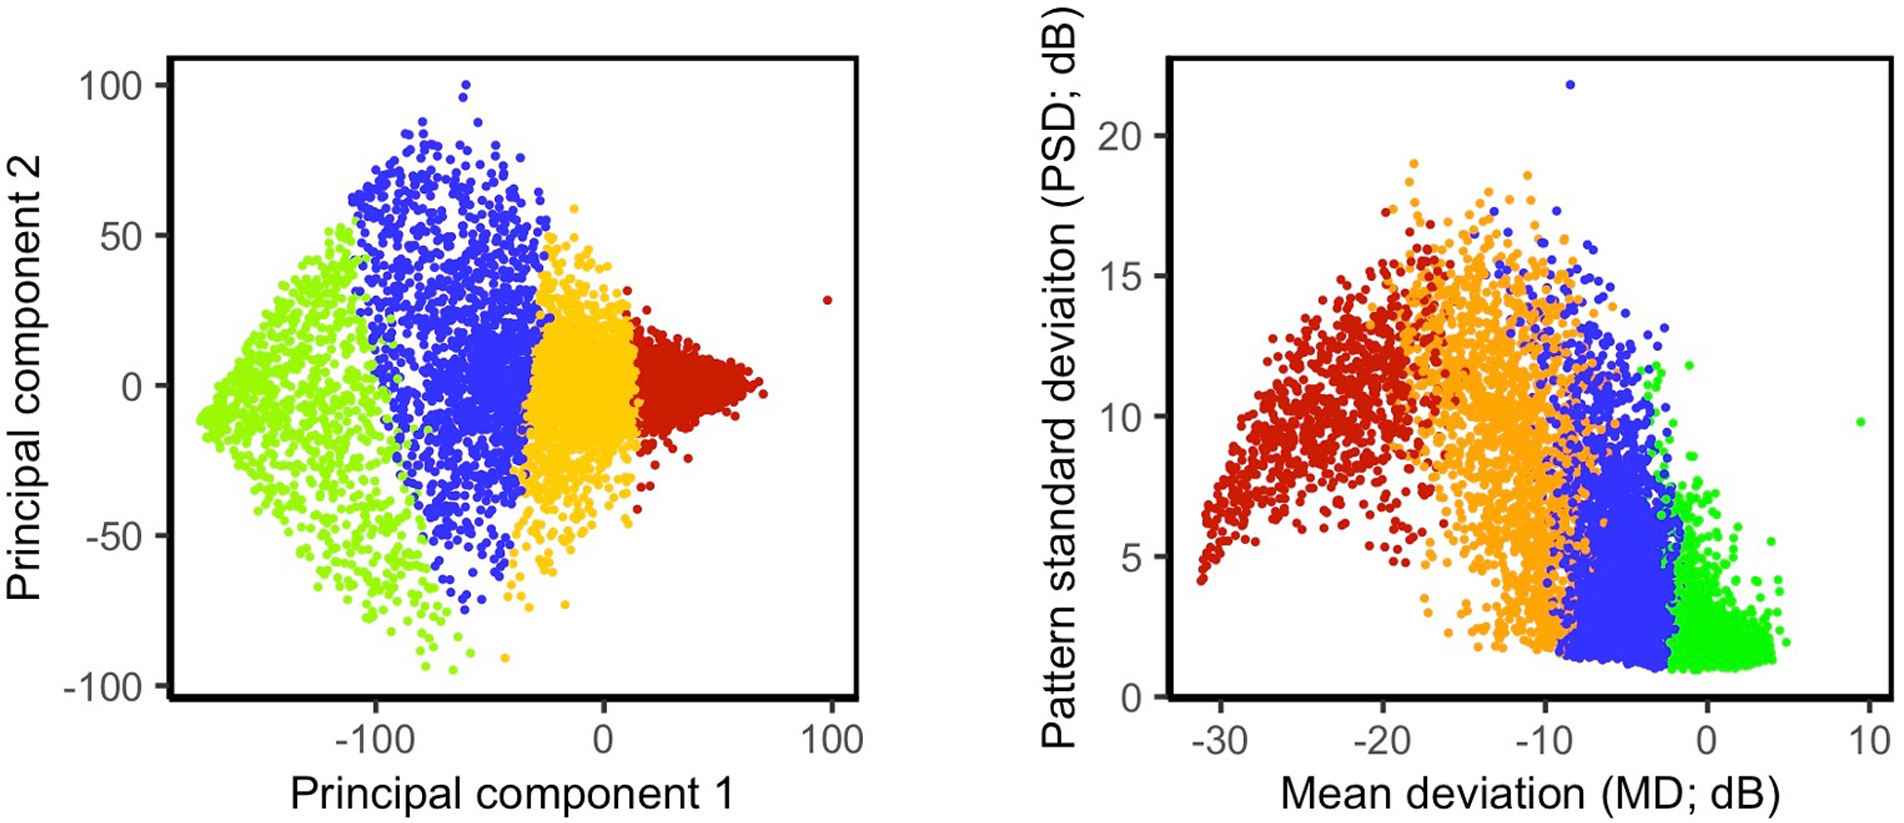
Figure 3.

Scatter plot of the statistical clusters. Left: Principal component analysis (PCA) was used to reduce the dimensionality of visual fields (VFs) from the initial 52 dimensions to two dimensions to visualize statistical clusters. Right: Statistical clusters are visualized based on mean deviation (MD) and pattern standard deviation (PSD). Green, blue, orange, and red colors represent eyes in the Normal, Early, Moderate, and Advanced statistical clusters.
