
FIGURE 2.
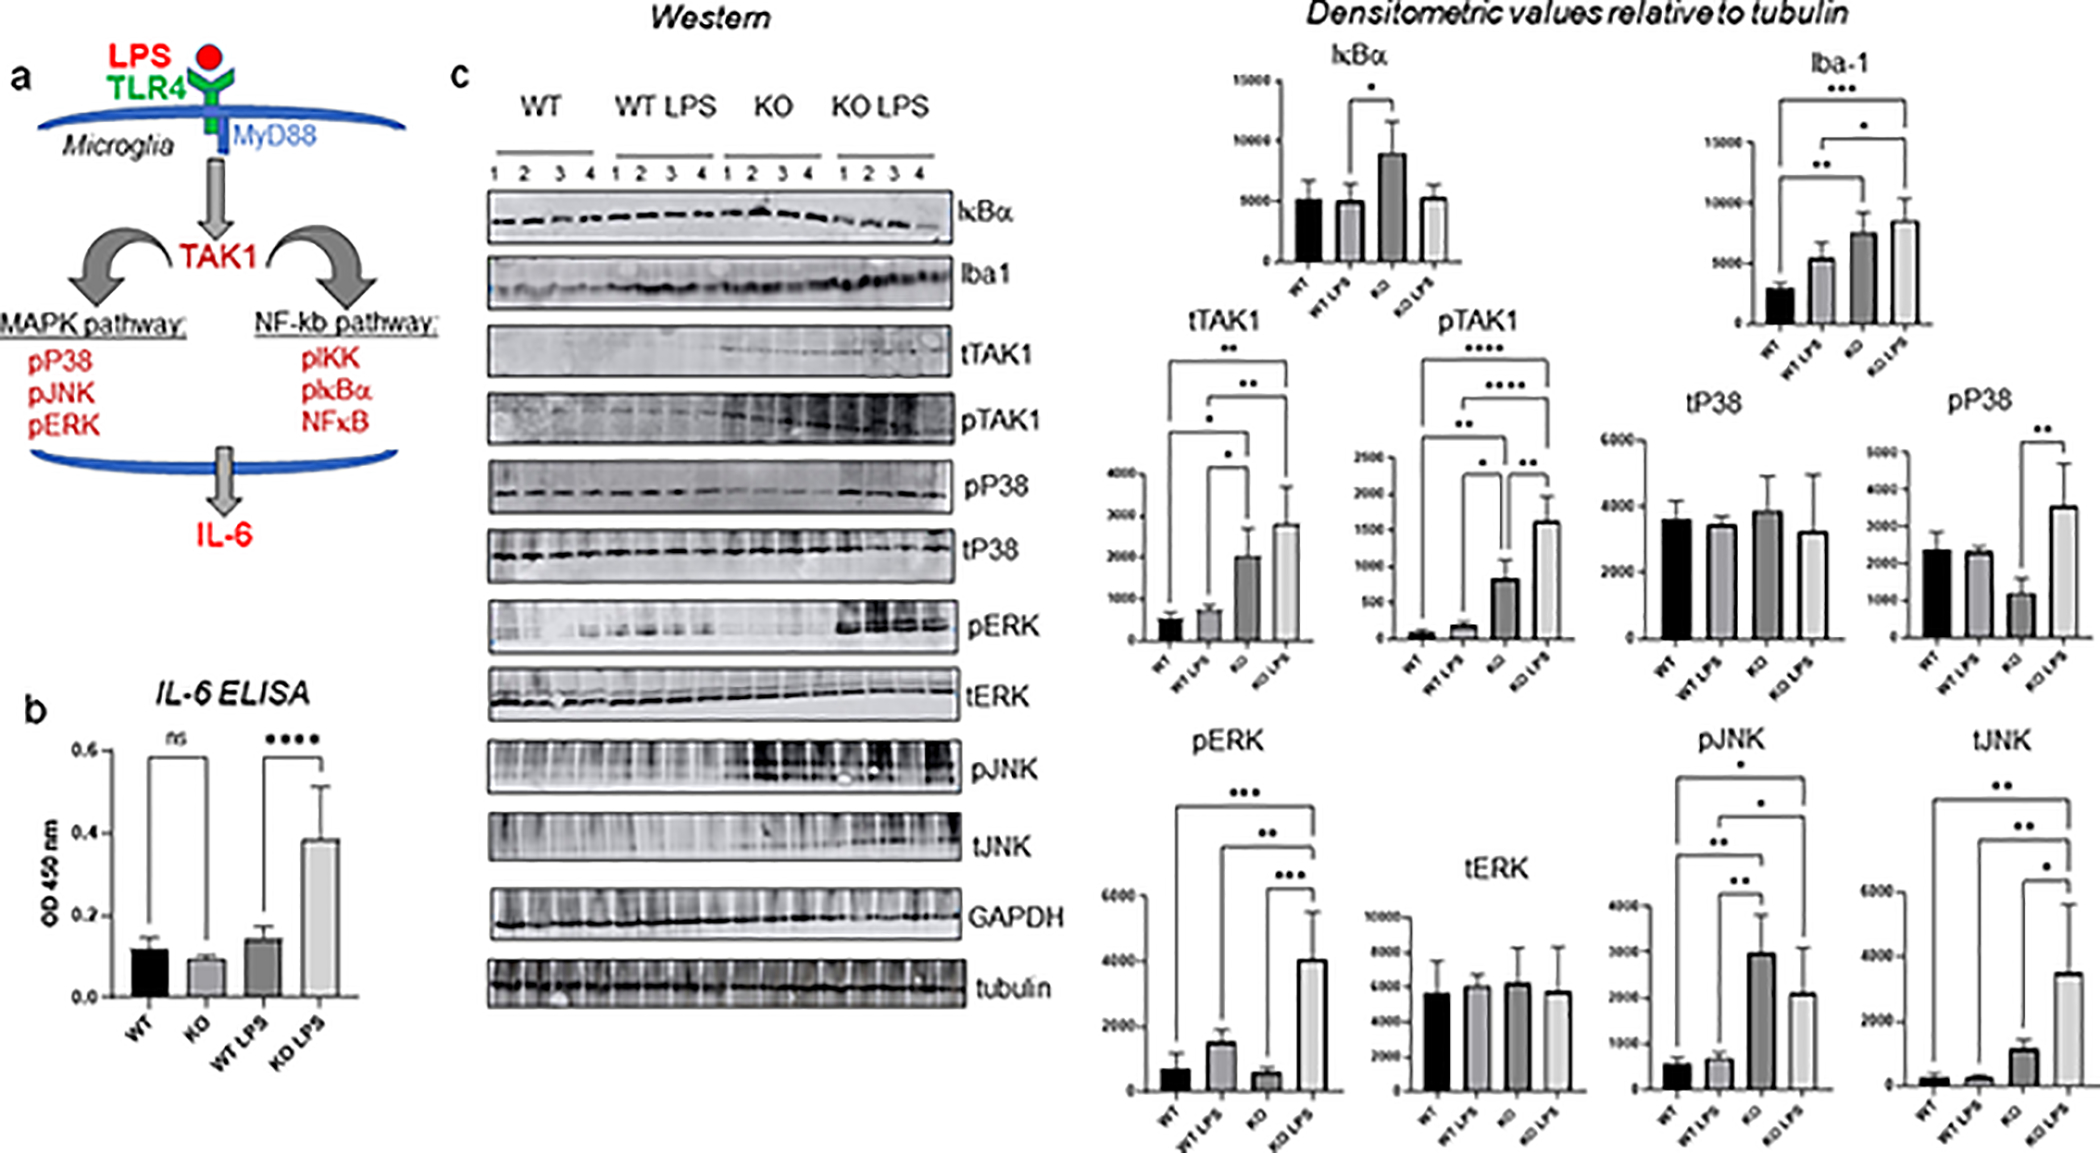
CPEB1 regulation of the signaling cascade leading to IL6 production. (a) illustration of LPS-induced signaling in microglia leading to IL6 production. (b) ELISA assays for IL6 in cortex from WT and CPEB1 KO mice injected with PBS or LPS (n=4, one-way ANOVA). (c) Western blots and quantification of signaling proteins and phospho-proteins in cortex from WT and CPEB1 KO mice injection with PBS or LPS (animal n=4, one-way ANOVA). *, p<0.05; **, p<0.01; ***, p<0.001; ****, p<0.0001.