FIGURE 6.

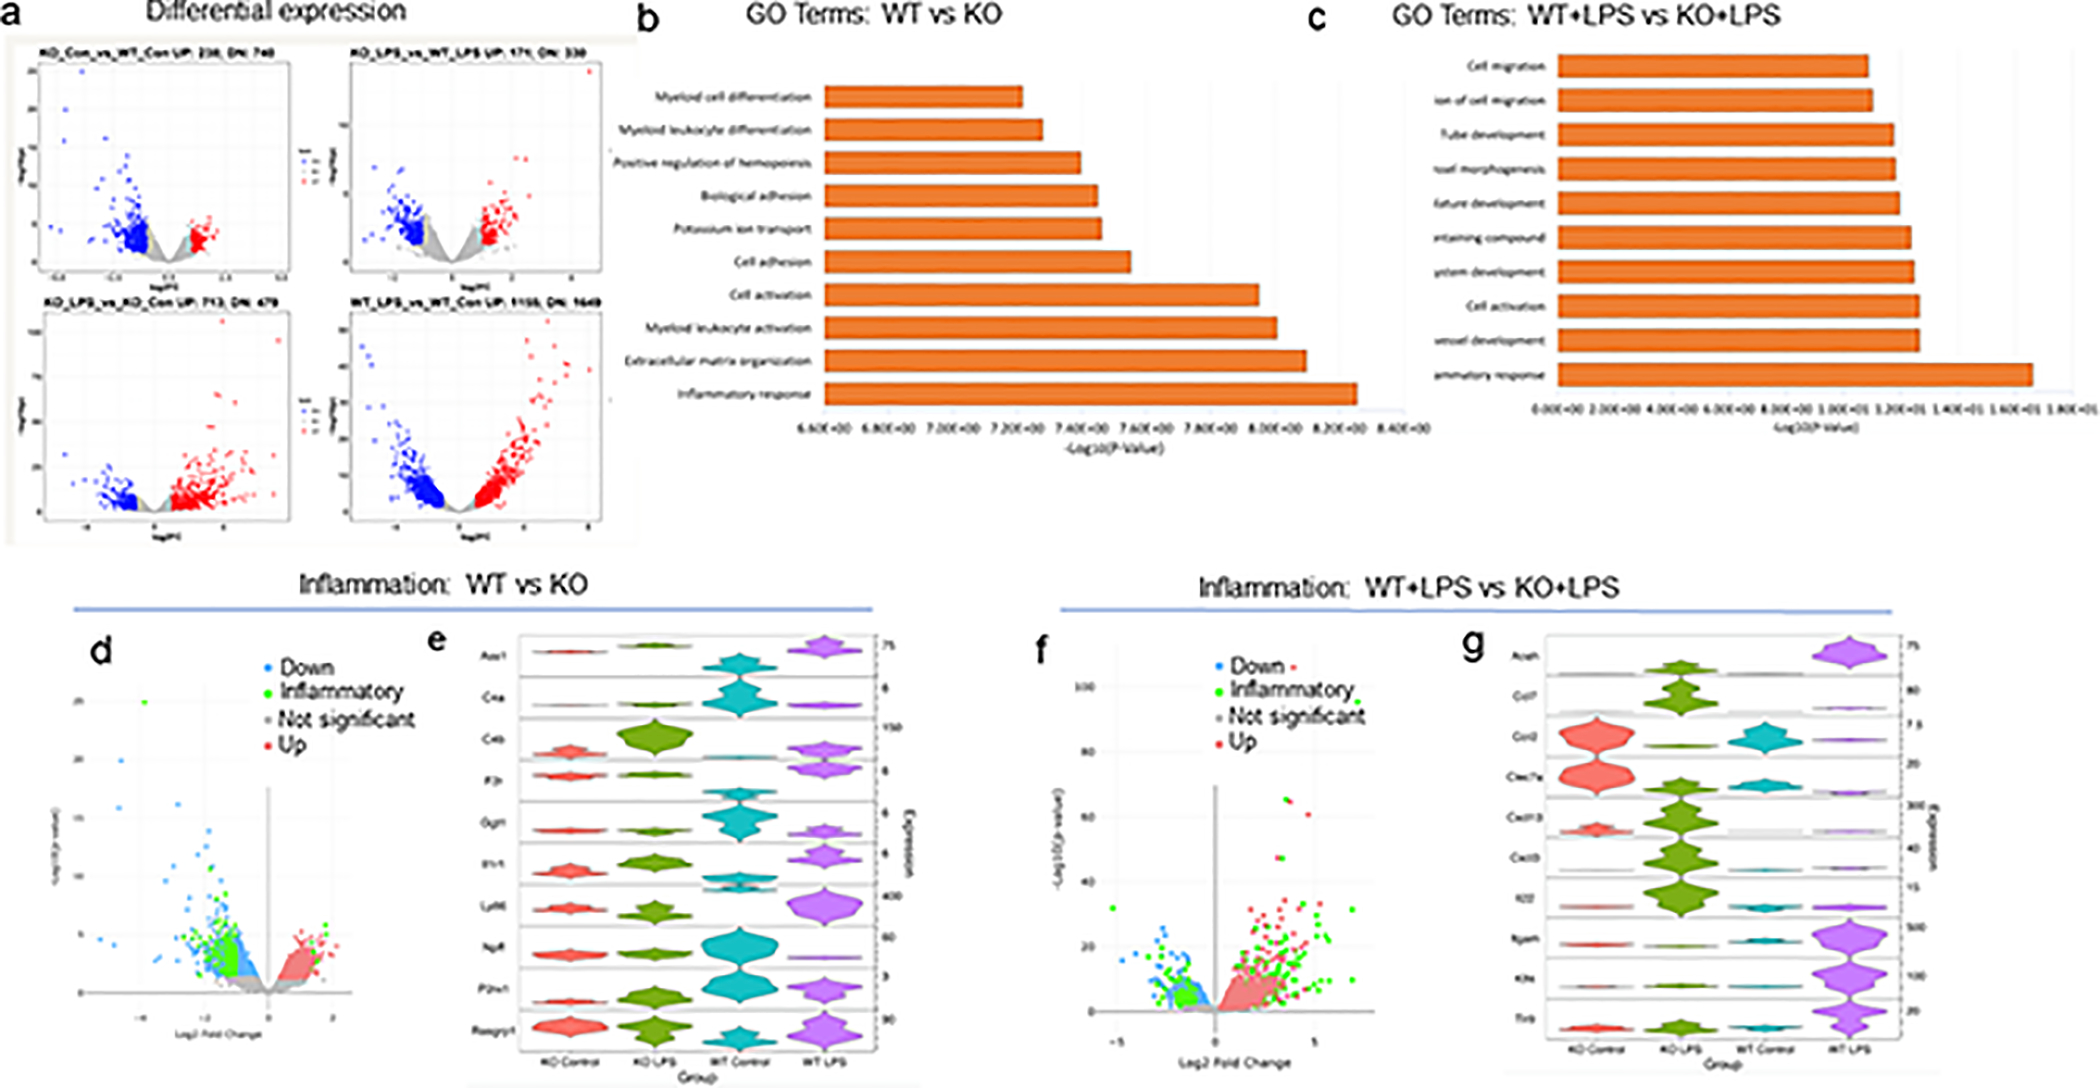
Analysis of RNA expression in CPEB1-deficient microglia. (a) Volcano plots showing differential expression when analyyzed pairwise between two conditions (KO vs WT; KO+LPS vs WT+LPS; KO+LPS vs KO; WT+LPS vs WT). The plots are log2FC vs -log10(p value). (b) GO term analysis of top 10 categories when comparing WT to KO. The most significant category is inflammatory response. (c) GO term analysis of top 10 categories when comparing WT+LPS to KO+LPS. The most significant category is inflammatory response. (d) Volcano plot of of differential expressed RNA comparing WT to KO microglia with emphasis on transcripts encoding inflammatory response proteins (green). (e) Violin plots of 10 RNAs that are the most altered, up or down, in WT vs KO microglia. The distribution of expression of RNAs is plotted for all 4 conditions (i.e., CPEB1 KO, CPEB1 KO+LPS, WT, WT+LPS). Significantly dys-regualted RNAs were determined by a fold change cutoff of 2 and a p-value cutoff of 0.05. The top 10 RNAs that pass this filter with changes both up and down are represented in the violin plot. Expression in transcripts per million (TPM). (f) Volcano plot of of differential expressed RNA comparing WT+LPS to KO+LPS microglia with emphasis on transcripts encoding inflammatory response proteins (green). (g) Violin plots of 10 RNAs that are the most altered, up or down, in WT+LPS vs KO+LPS microglia. All changes are p<0.05; expression in transcripts per million (TPM).
