
FIGURE 8.
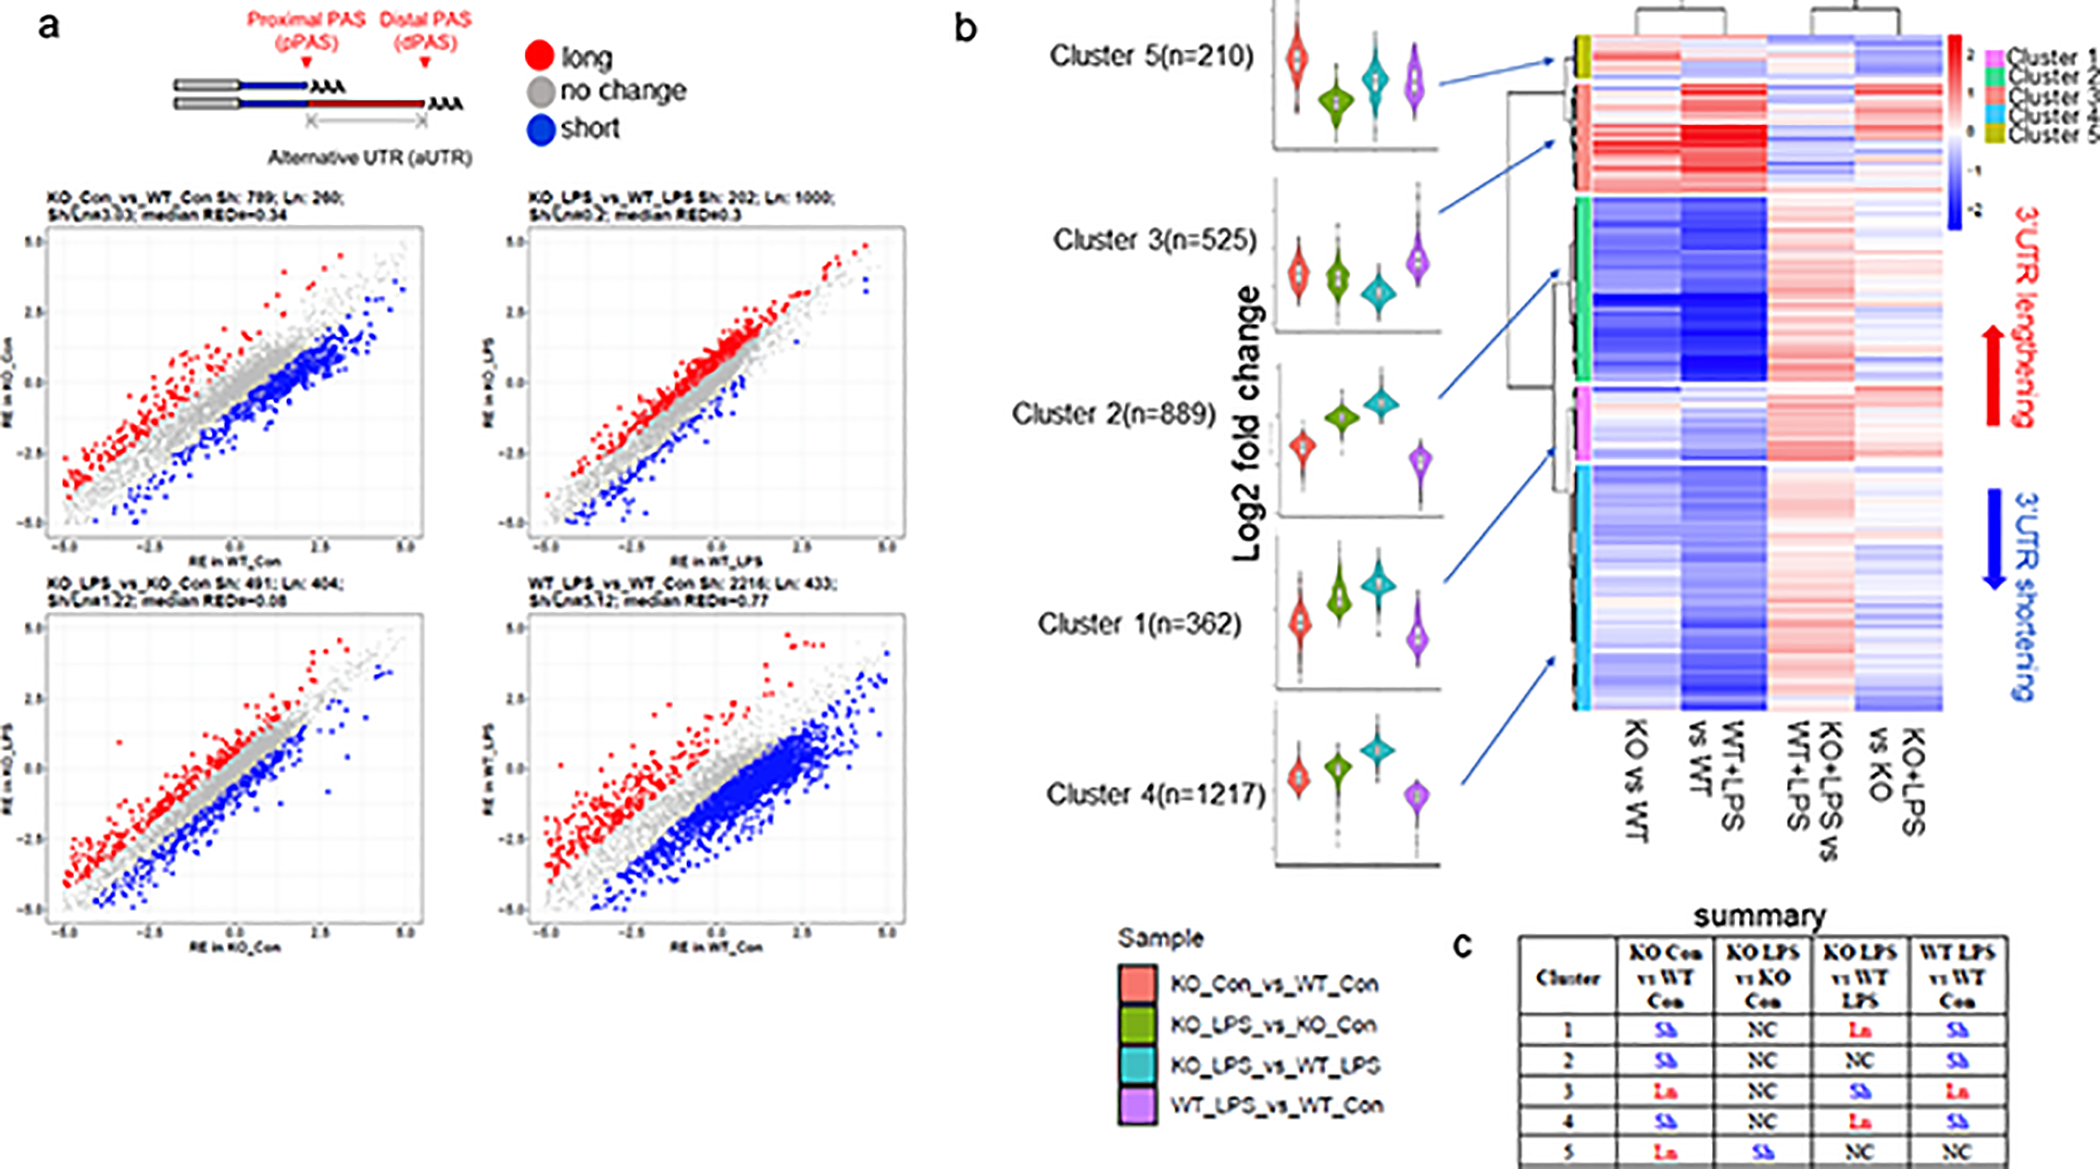
Alternative poly(A) site selection in CPEB1-deficient microglia. (a) At top is an illustration of proximal and distal poly(A) cleavage sites (PAS) leading to alterantive 3’ UTR length. At bottom is differential poly(A) site cealvage selection when comparing pairwise KO vs WT; KO+LPS vs WT+LPS; KO+LPS vs KO; WT+LPS vs WT). Long (red) or short (blue) 3’UTRs are indicated. (b) Cluster analysis of RNAs with long or short 3’ UTRs in the indicated pairwise comparisons (based on log2FC). The number of RNAs in each cluster is indicated. The color of the violin plots designate each pairwise comparison (sample). (c) Summary of short or long 3’UTRs in each cluster with the indicated pairwise comparison.