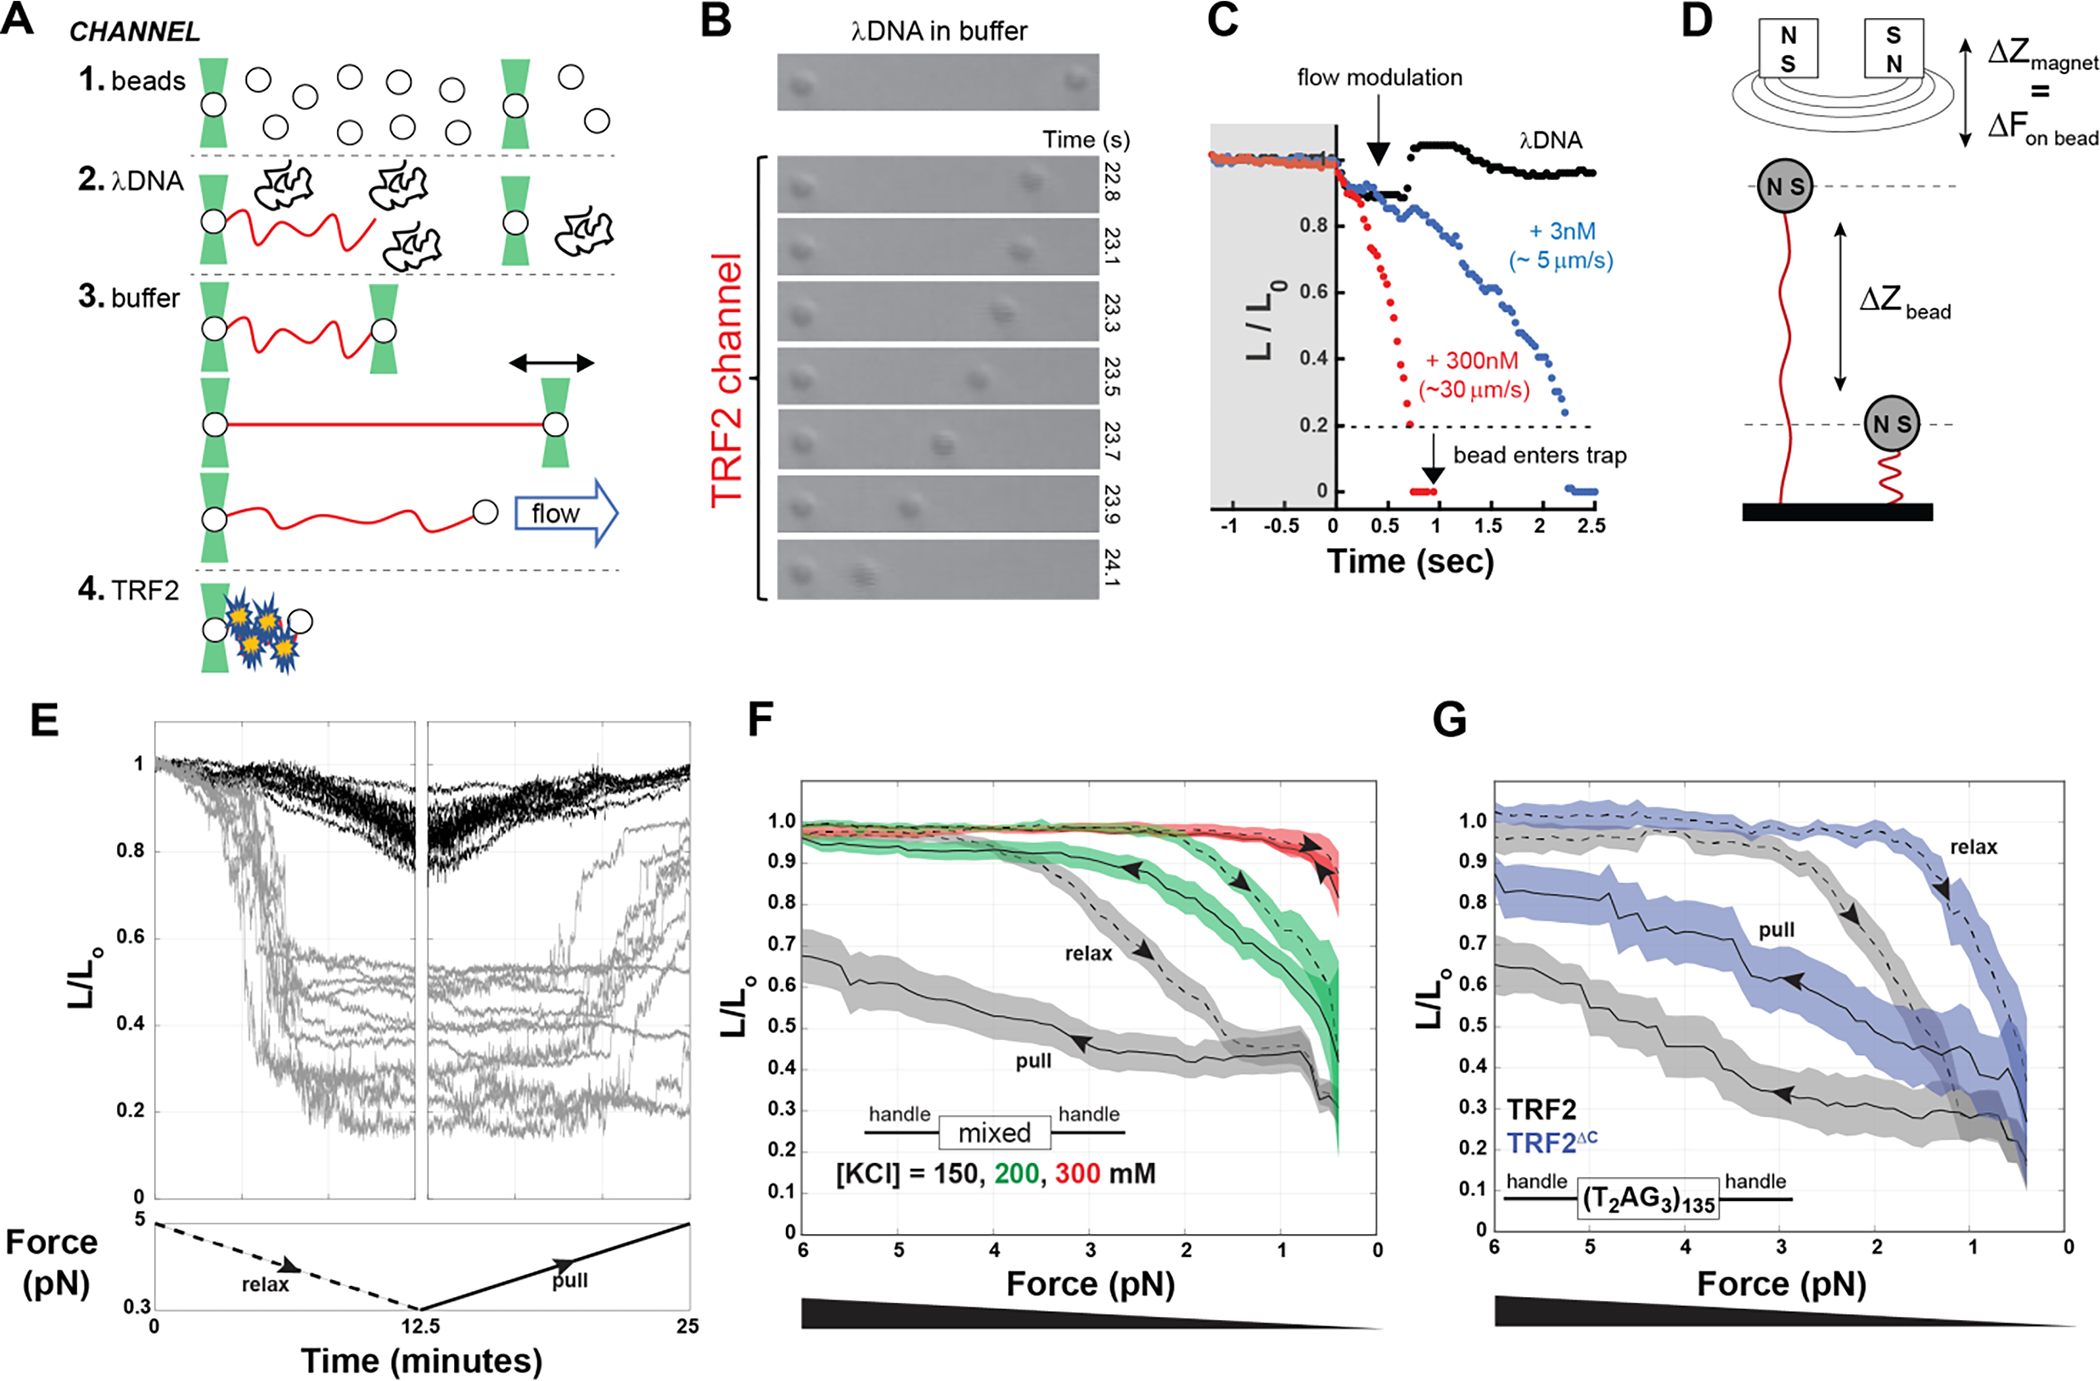
Figure 2. TRF2 condensation of single nucleic acids chains.

A. Schematic of optical tweezers experiments. 1 to 4 are schematics of the laminar flows used to assemble λDNA in a dumbbell configuration between two beads, before incubating it with protein. B and C. Compaction of DNA (expressed as the change in relative length L/L0) in presence of 300 nM (monomer) TRF2 as visually monitored by the decreasing distance between the beads over time (B) or quantified by tracking the position of the right bead (C), in the presence of TRF2 at 3 nM (blue) or at 300 nM (red) compared to the absence of TRF2 (black). D. Schematic of the magnetic tweezer experiment setup. E. Example of magnetic tweezer trajectories after relaxing (gray, first panel) and pulling (gray, second panel) the nucleic acid in the presence of TRF2. The DNA alone is shown as reference in black. F. Quantification of DNA compaction as function of force for dsDNA of mixed sequence in the presence of 300 nM TRF2 (dashed and solid lines are the average and color bands the standard deviation of multiple traces in either the relax or pull direction, respectively). Increasing KCl concentration decreases the hysteresis between relax and pull experiments as well as the degree of force required to expand the conformations of the DNA. G. DNA compaction measured for the specific telomeric DNA sequence in presence of 300 nM TRF2 or its variant TRF2ΔC, which lacks the DBD and the linker region.
