

Abstract
Purpose:
Telomere maintenance is a hallmark of cancer. Most tumors maintain telomere length via reactivation of telomerase reverse transcriptase (TERT) expression. Identifying clinically translatable imaging biomarkers of TERT can enable non-invasive assessment of tumor proliferation and response to therapy.
Methods:
We used RNA interference, doxycycline-inducible expression systems and pharmacological inhibitors to mechanistically delineate the association between TERT and metabolism in preclinical patient-derived tumor models. Deuterium magnetic resonance spectroscopy (2H-MRS), which is a novel, translational metabolic imaging modality, was used for imaging TERT in cells and tumor-bearing mice in vivo.
Results:
Our results indicate that TERT expression is associated with elevated NADH in multiple cancers, including glioblastoma, oligodendroglioma, melanoma, neuroblastoma, and hepatocellular carcinoma. Mechanistically, TERT acts via the metabolic regulator FOXO1 to upregulate nicotinamide phosphoribosyl transferase, which is the key enzyme for NAD+ biosynthesis, and the glycolytic enzyme glyceraldehyde-3-phosphate dehydrogenase, which converts NAD+ to NADH. Since NADH is essential for pyruvate flux to lactate, we show that 2H-MRS-based assessment of lactate production from [U-2H]-pyruvate reports on TERT expression in preclinical tumor models in vivo, including at clinical field strength (3T). Importantly, [U-2H]-pyruvate reports on early response to therapy in mice bearing orthotopic patient-derived gliomas at early timepoints before radiographic alterations can be visualized by magnetic resonance imaging.
Conclusions:
Elevated NADH is a metabolic consequence of TERT expression in cancer. Importantly, [U-2H]-pyruvate reports on early response to therapy, prior to anatomical alterations, thereby providing clinicians with a novel tool for assessment of tumor burden and treatment response in cancer.
Keywords: Telomerase reverse transcriptase (TERT), Deuterium (2H)-magnetic resonance spectroscopy/imaging (MRS/I), cancer, immortality, metabolic imaging, chemotherapy, TERT-inhibition
INTRODUCTION
Telomere shortening constitutes a natural barrier to cell proliferation (1). Telomeres are cap-like structures composed of telomeric DNA and specialized proteins that protect the ends of linear chromosomes from damage during replication (1). Telomerase reverse transcriptase (TERT) is the catalytic component of the enzyme telomerase that synthesizes telomeric DNA, and its expression is silenced in normal somatic cells, except stem cells (1,2). TERT expression is reactivated via mutations in the TERT promoter in ~85% of tumors, including glioblastomas, oligodendrogliomas, melanomas, hepatocellular carcinomas, and neuroblastomas (2–4). TERT promoter mutations create a binding site for the transcription factor GABP, which then activates TERT transcription and enables tumor cells to achieve replicative immortality (4,5) . Due to its essential role in proliferation, TERT is also a therapeutic target (1,2,6). Inhibition of TERT function using small molecules such as 6-thio-2′-deoxyguanosine (6-thio-dG) (7,8) or via antisense oligonucleotide-based inhibition of TERT expression (6) are promising anti-cancer strategies.
Magnetic resonance imaging (MRI) is a key tool for non-invasive diagnosis and treatment response assessment in cancer (9). However, anatomical imaging does not report on biological events that sustain tumor proliferation and fails to distinguish tumor from surrounding normal tissue or from morphologically similar areas of edema, necrosis or gliosis (10). Importantly, changes in tumor size can be slow to occur following treatment, leading to incorrect assessments of disease progression (11,12). Since TERT expression is specifically reactivated in cancer cells and plays a key role in tumor immortality (2), TERT is a biomarker of tumor proliferation. Identifying MR-based biomarkers of TERT expression can, therefore, enable imaging of tumor proliferation and response to therapy.
Previous studies have linked TERT to redox homeostasis in cancer. TERT has been shown to alleviate oxidative stress via upregulation of reduced glutathione (GSH) in HeLa cells (13). We and others have shown that TERT expression in gliomas is associated with elevated GSH, NADPH and NADH, which play key roles in redox maintenance (14–16). While these studies point to an association between TERT and altered redox, the precise mechanisms and the universality of TERT-linked redox alterations across multiple cancers remain elusive.
Magnetic resonance spectroscopy (MRS) is a non-invasive method of interrogating metabolism in vivo (11,17,18). 1H-MRS provides a readout of steady-state metabolism (17). Steady-state metabolite levels, however, do not accurately reflect the activity of a metabolic pathway and may not be sensitive to fluctuations in concentrations of cofactors such as NADH (19). Thermally polarized 13C-MRS following administration of 13C-labeled substrates is the gold standard for measuring dynamic metabolic activity (18). However, the low signal to noise ratio (SNR) of 13C-MRS prevents clinical integration. Although hyperpolarization has increased the SNR, hyperpolarized 13C-MRS requires expensive instrumentation and is technically demanding (20). Recently, 2H-MRS emerged as a versatile, technically simple, innovative method of examining metabolic activity in vivo (21–26). Following administration of 2H-labeled substrates such as glucose, acetate or fumarate, flux to metabolic products can be quantified in preclinical tumor models (21–26). Importantly, the feasibility of 2H-MRS has been established in glioblastoma patients (21).
The goal of this study was to delineate the mechanisms linking TERT to redox across multiple cancers and to leverage this information for non-invasive 2H-MRS-based imaging of tumor burden and treatment response. We show that TERT inhibits the transcription factor FOXO1 in patient-derived models of glioblastoma, oligodendroglioma, melanoma, neuroblastoma, and hepatocellular carcinoma. FOXO1, in turn, inhibits expression of nicotinamide phosphoribosyl transferase (NAMPT), the rate-limiting enzyme for NAD+ biosynthesis, and of glyceraldehyde-3-phosphate dehydrogenase (GAPDH), the glycolytic enzyme that converts NAD+ to NADH (27). As a result, TERT elevates steady-state NAD+, NADH and the NADH/NAD+ ratio. Importantly, we demonstrate that TERT expression can be visualized in vivo using 2H-MRS following administration of [U-2H]-pyruvate. Furthermore, [U-2H]-pyruvate reports on early response to therapy in vivo.
MATERIALS AND METHODS
Detailed methods are provided in the Supplementary material.
Patient-derived models and patient samples:
GBM1 and GBM6 were isolated from isocitrate dehydrogenase wild-type glioblastoma male patients as previously described (4,6,28). SF10417 and BT88 cells were isolated from male patients harboring isocitrate dehydrogenase mutant oligodendrogliomas (29,30). A375 (female), HepG2 (male) and SK-N-SH (female) cells were a kind gift from Dr. Joseph Costello and have been described (4). All cells were maintained as previously described (4,6,28–30). Cell lines were routinely tested for mycoplasma contamination, authenticated by short tandem repeat fingerprinting and assayed within 6 months of authentication. Patient biopsies were obtained from the UCSF Brain Tumor Center Biorepository in compliance with written informed consent policy (15,16,31,32). Biopsies use was approved by the Committee on Human Research at UCSF and research was approved by the Institutional Review Board at UCSF according to ethical guidelines established by the U.S. Common Rule.
Silencing and overexpression studies:
SMARTpool siRNAs (Dharmacon) against human TERT, FOXO1 or non-targeting siRNA were used to silence gene expression (15,16,31,32). For exogenous expression of CA-FOXO1, TERT+ cells were transiently transfected with human CA-FOXO1 (pcDNA3 Flag-FKHR-AAA mutant; Addgene). CA-FOXO1 expression was verified at 72h by western blotting for the FLAG tag. For NAMPT and GAPDH overexpression in TERT− cells, cells were transfected with siTERT siRNA for 24h, washed and transiently transfected with human NAMPT or GAPDH cDNA (Origene), and expression confirmed by quantitative RT-PCR. To silence FOXO1 in TERT− cells, cells were transfected with siTERT siRNA for 24h, washed and transiently transfected with siFOXO1 siRNA. FOXO1 silencing was verified at 72h by quantifying FOXO1 transcription factor activity as described below. For doxycycline-inducible TERT silencing, microRNA-embedded miR-E shRNA against TERT was cloned into a lentiviral vector (pCW57-TurboGFP-miR-E-puro). Lentiviral particles were produced by transient transfection of psPAX2 (Addgene #12260), pMD2.G (Addgene #12259), and transfer plasmid (pCW57-CMV-GFP-miR-E-IRES-puro-shRNA) into HEK293T cells. HepG2 cells were transduced with lentivirus followed by puromycin selection.
Gene expression:
Gene expression was measured by quantitative RT-PCR and normalized to β-actin (6,33). The SYBR Green quantitative RT-PCR kit (Sigma) was used with the following primers: TERT (forward primer: TCACGGAGACCACGTTTCAAA; reverse primer: TTCAAGTGCTGTCTGATTCCAAT), NAMPT (forward primer: GTTCCAGCAGCAGAACACAG; reverse primer: GCTGACCACAGATACAGGCA), FOXO1 (forward primer: GCAGCCAGGCATCTCATAA; reverse primer: CCTACCATAGCCATTGCAGC), GAPDH (forward primer: GTCTCCTCTGACTTCAACAGCG; reverse primer: ACCACCCTGTTGCTGTAGCCAA), and β-actin (forward primer: AGAGCTACGAGCTGCCTGAC; reverse primer: AGCACTGTGTTGGCGTACAG).
Activity assays:
Telomerase activity was confirmed using the TRAPeze® RT kit (Sigma). NAMPT (Abcam, #ab221819) and GAPDH (Biovision, #K680) activity were measured using kits. FOXO1 transcription factor activity was measured using a kit (Abcam, #ab207204). Briefly, the assay measures binding of active FOXO1 to a DNA sequence containing the FOXO1 binding site. FOXO1 is detected using a primary antibody that recognizes an epitope of FOXO1 accessible only when the protein is active and bound to its target DNA. Levels of total and phosphorylated FOXO1 in the cytosol and nucleus were quantified using a fluorescence resonance energy transfer assay (Perkin Elmer). NAD+ and NADH were measured using a kit (Biovision, #K337). For supplementation studies, NMN (1mM), NA (1mM) or tryptophan (0.25mM) was added to the medium. GSH and oxidized glutathione (GSSG) were measured using a kit (Abcam, #ab205811). NADPH and NADP+ were measured using a kit (Abcam, #176724).
Western blotting:
Protein was separated by sodium dodecyl sulphate polyacrylamide gel electrophoresis, transferred onto Immobilon-FL membrane and probed for FOXO1 (Cell Signaling, #2880), phospho-FOXO1 S256 (Cell Signaling, #84192), FLAG (Cell Signaling, anti-FLAG M2, #14793). β-actin (Cell Signaling, 4970) was used as loading control.
MRS of cell extracts:
Metabolites were extracted by the methanol-chloroform method (31,32). For 13C MRS, cells were cultured in medium containing 5mM [3-13C]-pyruvate for 48h. 1H- and 13C-MR spectra were obtained using a 11.7T spectrometer. Peak integrals were quantified and normalized to an external reference and to cell number (31,32).
2H-MRS of live cells:
Cells were incubated in media containing 10mM [U-2H]-pyruvate for 72h. Live cells were harvested, suspended in saline and 2H-MR spectra acquired on a Varian 14.1T scanner using a 16mm 2H surface coil and a pulse-acquire sequence (TR=260ms, NA=2500, complex points=512, flip angle=64°, spectral width=2kHz). Peak integrals were corrected for saturation and converted to mM concentration using the natural abundance HDO signal (4.75ppm; 12.8mM). The latter was determined assuming a 55.5M water concentration and a deuterium natural abundance of 0.0156%.
MRI:
Animal studies were conducted in accordance with UCSF Institutional Animal Care and Use Committee (IACUC) guidelines. GBM1, GBM6, BT88 or SF10417 cells were intracranially injected and HepG2dox-TERT cells injected subcutaneously into SCID mice (31,32,34,35). Once tumors reached a volume of 27.0±7.8mm3 (orthotopic brain) or 180.3±24.7mm3 (subcutaneous), this timepoint was considered day zero (D0). Mice were randomized and treated with vehicle-control (saline), temozolomide (TMZ; 50mg/kg), 6-thio-dG (50mg/kg) or doxycycline (50mg/kg) daily via intraperitoneal injection. Animals under doxycycline treatment also received doxycycline-enriched food ad libitum. MR studies were performed on a Varian 14.1T scanner equipped with a 1H volume coil. Axial T2-weighted or T1-weighted images were acquired using a spin-echo multi-slice sequence (TE/TR=20/1200ms, FOV=30x30mm2, matrix=256x256, slice thickness=1mm, NA=4) (31,32,35) or a gradient-echo multi-slice sequence (TE/TR=2.09/120ms, FOV=30x30mm2, matrix=256x256, slice thickness=1mm, NA=10) respectively. Tumors were contoured manually, and volume calculated as the sum of the areas multiplied by slice thickness (31,32,35). Dynamic contrast enhanced (DCE)-MRI was performed in mice bearing orthotopic GBM6 tumors at day 0 and day 5 of TMZ treatment using a 1H volume coil at 14.1T. Axial T1-weighted images were acquired before and after intravenous injection of gadopentetate dimeglumine. Signals from the image series were analyzed using in-house Matlab codes and slope values calculated (see Supplementary Methods).
2H-MRS in vivo:
Studies were performed on a Varian 14.1T or a Bruker 3T scanner using a 16mm 2H surface coil. Following intravenous injection of a bolus of [U-2H]-pyruvate (450mg/kg), non-localized 2H-MR spectra were acquired with a pulse-acquire sequence (TR=500ms, NA=500, complex points=512, flip angle=64, spectral width=2kHz, temporal resolution=4min 10s at 14.1T; TR=506.361ms, NA=1000, complex points=256, flip angle=64, spectral width=512.8Hz, temporal resolution=8min 26s at 3T). Non-localized 2H-MR spectra were analyzed using MestReNova. Absolute metabolites concentrations were determined by correcting peak integrals for saturation and normalizing to pre-injection HDO (estimated to be 10.12mM (21,23,24)). For spatial localization, a 2D chemical shift imaging (CSI) sequence with a temporal resolution of 4min 10s (TE/TR=1.35/250ms, FOV=30x30x8mm3, 128 points, 2.5kHz spectral width, NA=20, nominal voxel size=112.5μl) was used at 14.1T. Data were analyzed using in-house Matlab codes (15,16,26). For each voxel at every time point, peak integrals were calculated. For generation of heatmaps of 2H-lactate, raw data were interpolated from an 8x8 matrix to a 256x256 matrix. Data were normalized to noise for SNR heatmaps or pre-injection HDO for concentration heatmaps. The concentration of 2H-lactate was quantified in a 10.99mm3 volume from tumor and contralateral normal brain.
Statistical analysis:
All experiments were performed on a minimum of 3 samples (n≥3) and results presented as mean ± standard deviation. Statistical significance was assessed in GraphPad Prism 9 using a two-way ANOVA or two-tailed Student’s T-test assuming unequal variance with p<0.05 considered significant. Analyses were corrected for multiple comparisons using Tukey’s method, wherever applicable. *=p<0.05, **=p<0.01, ***=p<0.001 and ****=p<0.0001.
Data availability:
Data included in this manuscript that support the findings and conclusions of this study are available from the corresponding author upon reasonable request.
RESULTS
TERT expression is associated with elevated NADH and NADH/NAD+ ratio in cancer
The redox environment of mammalian cells is regulated by levels of redox-reactive small molecules including GSH, GSSG, NADPH, NADP+, NADH and NAD+ (36). To determine whether TERT is linked to redox across multiple cancers, we examined the effect of silencing TERT in glioblastoma (GBM1, GBM6), oligodendroglioma (SF10417, BT88), melanoma (A375), neuroblastoma (SK-N-SH) and hepatocellular carcinoma (HepG2) models. We confirmed that TERT mRNA and telomerase activity were significantly reduced in TERT− cells relative to TERT+ (Supplementary Fig. S1A–S1B). TERT silencing significantly reduced steady-state pools of NADH and NAD+ and the NADH/NAD+ ratio in all models (Fig. 1A–1C). In contrast, silencing TERT significantly reduced GSH and NADPH in glioblastoma, oligodendroglioma and melanoma, but not neuroblastoma or hepatocellular carcinoma (Supplementary Fig. S1C–S1D). There was no change in GSSG or NADP+ following TERT silencing in any model (Supplementary Fig. S1E–S1F). These results identify elevated NADH and NADH/NAD+ ratio as common metabolic alterations linked to TERT expression in cancer.
Figure 1. TERT elevates NADH and the NADH/NAD+ ratio in cancer cells via upregulation of NAMPT and GAPDH.
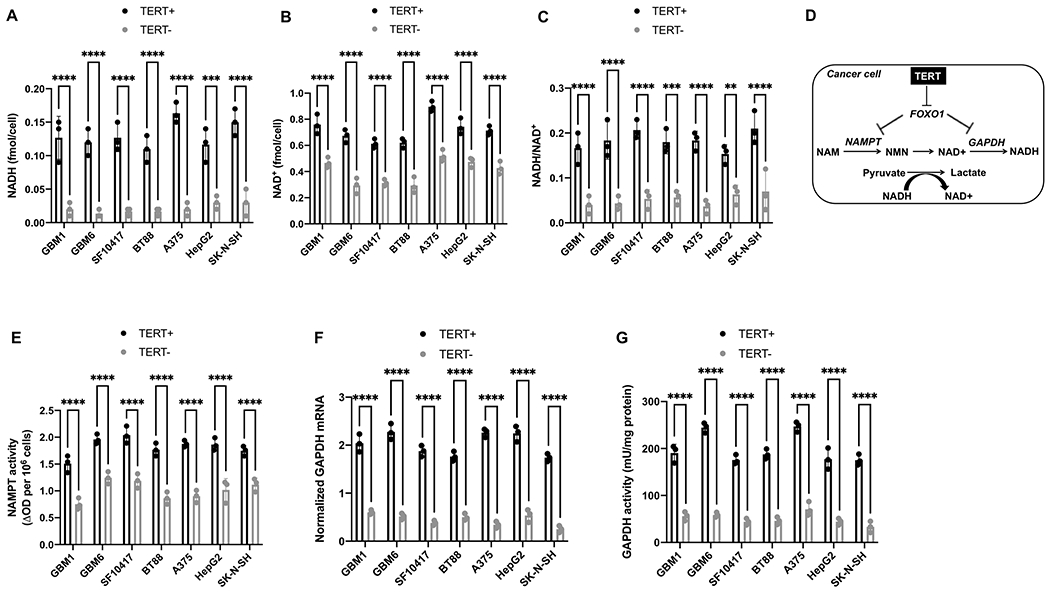
NADH (A), NAD+ (B) and NADH/NAD+ ratio (C) in TERT+ and TERT− glioblastoma (GBM1, GBM6), oligodendroglioma (SF10417, BT88), melanoma (A375), hepatocellular carcinoma (HepG2) and neuroblastoma (SK-N-SH) cells. (D) Schematic illustration of the link between TERT, FOXO1, NAMPT, GAPDH, NADH and pyruvate flux to lactate in TERT+ cancer cells. NAM refers to nicotinamide; NMN is nicotinamide mononucleotide. NAMPT activity (E), GAPDH mRNA (F) and GAPDH activity (G) in TERT+ and TERT− glioblastoma (GBM1, GBM6), oligodendroglioma (SF10417, BT88), melanoma (A375), hepatocellular carcinoma (HepG2) and neuroblastoma (SK-N-SH) cells. Bars depict mean values and error bars represent standard deviation. ** represents p<0.01, *** represents p<0.001 and **** represents p<0.0001.
TERT upregulates NAMPT and GAPDH
First, we examined the mechanism leading to elevated NAD+ and NADH in TERT+ cells. Although NAD+ can be synthesized de novo from dietary tryptophan or nicotinic acid, it is mostly recycled via the salvage pathway from nicotinamide (NAM), which is converted to nicotinamide mononucleotide (NMN) in a rate-limiting reaction catalyzed by NAMPT (see Fig. 1D) (27,37). NMN is subsequently adenylated to NAD+. Silencing TERT significantly reduced NAMPT expression (Supplementary Fig. S2A) and activity (Fig. 1E) in all models. Exogenous supplementation with NMN, which is the product of NAMPT, restored NAD+ and NADH in TERT− cells to levels observed in TERT+ cells (Supplementary Fig. S2B–S2C). In contrast, supplementation with tryptophan or nicotinic acid, which are precursors for de novo biosynthesis (27,37), did not rescue NAD+ and NADH in TERT− cells (Supplementary Fig. S2D–S2G).
Next, we examined the mechanism leading to an elevated NADH/NAD+ ratio in TERT+ cells since an increase in steady-state NAD+ and NADH does not explain an elevated NADH/NAD+ ratio. GAPDH is a glycolytic enzyme that converts NAD+ to NADH. As shown in Fig. 1F–1G, GAPDH expression and activity were significantly reduced in TERT− cells relative to TERT+. Collectively, our studies suggest that NAMPT increases steady-state pools of NAD+ and NADH while GAPDH increases the NADH/NAD+ ratio in TERT+ cancer cells.
TERT acts via FOXO1 to upregulate NAMPT and GAPDH
The forkhead box O (FOXO) family of transcription factors, including FOXO1, regulate metabolism and redox homeostasis (38). A major mechanism of FOXO1 regulation involves inhibitory phosphorylation on 3 serine/threonine residues (T24, S256, and S319) (38,39). Phospho-FOXO1 is sequestered in the cytoplasm and excluded from the nucleus, which prevents transactivation of FOXO1 target genes in the nucleus (38,39). To determine whether FOXO1 plays a role in TERT+ cells, we first examined the effect of silencing TERT on FOXO1. As shown in Fig. 2A, levels of phospho-FOXO1 were significantly reduced in TERT− cells relative to TERT+. There was no difference in total FOXO1 between TERT+ and TERT− cells. We also confirmed that FOXO1 was predominantly cytosolic and phosphorylated in TERT+ cells and that silencing TERT reduced phosphorylation and led to nuclear accumulation of FOXO1 (Supplementary Fig. S3A–S3C). Concomitantly, FOXO1 transcription factor activity, as quantified by an ELISA assay that detects FOXO1 in its active DNA-bound form, was elevated in TERT− cells relative to TERT+ (Fig. 2B).
Figure 2. TERT acts via the FOXO1 transcription factor to upregulate NAMPT and GAPDH.

(A) Western blots for phosphorylated and total FOXO1 protein in TERT+ and TERT− glioblastoma (GBM1), oligodendroglioma (BT88), melanoma (A375), neuroblastoma (SK-N-SH) and hepatocellular carcinoma (HepG2) cells. (B) FOXO1 transcription factor activity in TERT+ and TERT− glioblastoma (GBM1, GBM6), oligodendroglioma (SF10417, BT88), melanoma (A375), hepatocellular carcinoma (HepG2) and neuroblastoma (SK-N-SH) cells. Effect of expressing a constitutively active form of FOXO1 (CA-FOXO1) in TERT+ cells on NAMPT activity (C), GAPDH activity (D), NADH (E) and the NADH/NAD+ ratio (F) in glioblastoma (GBM1, GBM6), oligodendroglioma (SF10417, BT88), melanoma (A375), hepatocellular carcinoma (HepG2) and neuroblastoma (SK-N-SH) models. Bars depict mean values and error bars represent standard deviation. * represents p<0.05, ** represents p<0.01, *** represents p<0.001 and **** represents p<0.0001.
To further confirm these results, we expressed a constitutively active form of FOXO1 (hereafter named CA-FOXO1) in TERT+ cells (39). CA-FOXO1 is a FLAG-tagged form of FOXO1 that is constitutively active since all three phosphorylation sites have been mutated to alanine (39). We confirmed CA-FOXO1 expression and elevated FOXO1 transcription factor activity in transfected TERT+ cells (Supplementary Fig. S3D–S3E). Expression of CA-FOXO1 in TERT+ cells mimicked TERT silencing and significantly reduced NAMPT expression (Supplementary Fig. S3F), NAMPT activity (Fig. 2C), GAPDH expression (Supplementary Fig. S3G), GADPH activity (Fig. 2D), NAD+ (Supplementary Fig. S3H), NADH (Fig. 2E) and the NADH/NAD+ ratio (Fig. 2F). Conversely, silencing FOXO1 in TERT− cells (Supplementary Fig. S3I) mimicked TERT expression and restored NAMPT, GAPDH, NADH and the NADH/NAD+ ratio to levels observed in TERT+ cells (Supplementary Fig. S3J–S3M).
To confirm the clinical relevance of our findings, we examined biopsies from glioblastoma and oligodendroglioma patients and compared to non-neoplastic gliosis biopsies since obtaining normal brain tissue is not feasible. As shown in Supplementary Fig. S4A–S4B, TERT expression and telomerase activity were significantly higher in glioblastoma and oligodendroglioma biopsies relative to gliosis. Importantly, FOXO1 activity was significantly reduced while NAMPT activity, GAPDH activity and NADH were significantly elevated in glioblastoma and oligodendroglioma biopsies relative to gliosis (Fig. 3A–3C and Supplementary Fig. S4C). Collectively, our results suggest that FOXO1 negatively regulates NAMPT and GAPDH. Inhibitory phosphorylation of FOXO1 by TERT upregulates NAMPT and GAPDH and consequently elevates NAD+, NADH and the NADH/NAD+ ratio (see schematic in Fig. 1D).
Figure 3. [U-2H]-pyruvate can non-invasively monitor TERT expression in vivo.

FOXO1 transcription factor activity (A), NAMPT activity (B) and GAPDH activity (C) in glioblastoma, oligodendroglioma and gliosis biopsies. (D) Representative 2H-MR spectra from TERT+ and TERT− BT88 cells cultured in medium containing 10mM [U-2H]-pyruvate for 72h. A representative spectrum acquired from neat culture medium containing 10mM [U-2H]-pyruvate is also shown. Peaks for semi-heavy water (HDO; 4.75ppm), pyruvate (2.4ppm) and lactate (1.3ppm) are labeled. (E) Effect of TERT silencing on 2H-lactate production from [U-2H]-pyruvate in glioblastoma (GBM1), oligodendroglioma (BT88), melanoma (A375), hepatocellular carcinoma (HepG2) and neuroblastoma (SK-N-SH) cells. (F) Representative 2H-MR spectral array acquired from a saline-treated mouse bearing a subcutaneous HepG2dox-TERT tumor following intravenous injection of [U-2H]-pyruvate. The first spectrum is acquired prior to [U-2H]-pyruvate injection. Inset shows an expansion of the spectrum with the highest lactate signal (2nd spectrum following [U-2H]-pyruvate injection). (G) Concentration of 2H-lactate produced from [U-2H]-pyruvate at day 0 and day 7 in saline- and doxycycline (DOX)-treated mice bearing subcutaneous HepG2dox-TERT tumors. (H) Tumor volume at day 0 and day 7 in saline- and doxycycline (DOX)-treated mice bearing subcutaneous HepG2dox-TERT tumors. Bars depict mean values and error bars represent standard deviation. ** represents p<0.01, *** represents p<0.001 and **** represents p<0.0001.
[U-2H]-pyruvate non-invasively monitors TERT expression in vivo
NADH is essential for the conversion of pyruvate to lactate by lactate dehydrogenase A (LDHA). Previous studies have demonstrated that lactate production from pyruvate depends on levels of NADH (40) and the NADH/NAD+ ratio (41). Since our data points to elevated NADH and NADH/NAD+ ratio in TERT+ cells, we questioned whether TERT expression is linked to lactate production from pyruvate. To this end, we first examined [3-13C]-pyruvate metabolism in TERT+ and TERT− cells using thermally polarized 13C-MRS, which is the gold standard for measuring dynamic metabolic activity (18). As shown in Supplementary Fig. S4D–S4E, [3-13C]-lactate production was significantly reduced in TERT− cells relative to TERT+. In contrast, TERT silencing did not alter [4-13C]-glutamate production from [3-13C]-pyruvate (Supplementary S4F). We also confirmed that TERT silencing did not alter other factors that influence pyruvate conversion to lactate such as LDHA expression and the steady-state lactate pool size (Supplementary Fig. S4G–S4H).
To determine whether NAMPT and GAPDH are linked to reduced lactate production following TERT silencing, we examined the effect of overexpressing them in TERT− cells. As shown in Supplementary Fig. S5A–S5D, NAMPT overexpression in TERT− cells restored NAD+, NADH and [3-13C]-lactate production from [3-13C]-pyruvate to levels observed in TERT+ cells. Similarly, overexpressing GAPDH in TERT− cells restored the NADH/NAD+ ratio and [3-13C]-lactate production from [3-13C]-pyruvate to levels seen in TERT+ cells (Supplementary Fig. S5E–S5G).
2H-MRS following administration of 2H-labeled substrates is a novel, clinically translatable imaging modality. We, therefore, examined whether 2H-MRS-based assessment of [U-2H]-pyruvate metabolism reports on TERT expression in live cells. Representative 2H-MR spectra acquired from neat cell culture medium (prior to incubation with cells) showed peaks for the natural abundance of semi-heavy water (HDO, 4.75 ppm) and [U-2H]-pyruvate (2.4 ppm; Fig. 3D). 2H-MR spectra acquired following incubation of live BT88 cells with media containing [U-2H]-pyruvate showed lactate (1.3 ppm) production with higher levels in TERT+ cells relative to TERT− cells (Fig. 3D). Importantly, quantification of the results indicated that silencing TERT significantly reduced lactate production from [U-2H]-pyruvate (Fig. 3E).
Next, we examined the ability of [U-2H]-pyruvate to monitor TERT expression in vivo by investigating HepG2 tumors in which TERT was silenced in a doxycycline-inducible manner. We confirmed that TERT expression and telomerase activity were significantly reduced by doxycycline in HepG2dox-TERT cells (Supplementary Fig. S6A–S6B). Doxycycline-induced TERT silencing significantly increased FOXO1 transcription factor activity and decreased NADH and NAD+ in HepG2dox-TERT cells (Supplementary Fig. S6C–S6E). We then examined mice bearing subcutaneous HepG2dox-TERT tumors treated with vehicle-control (saline) or doxycycline. TERT expression and telomerase activity were significantly reduced at day 8 relative to day 0 in doxycycline-treated, but not saline-treated tumors (Supplementary Fig. S6F–S6G). As shown in the representative in vivo 2H-MR spectral array in Fig. 3F, dynamic lactate production from [U-2H]-pyruvate was observed in HepG2dox-TERT tumor-bearing mice. We detected a small peak for pyruvate in the spectral array (42,43). There was no significant difference in lactate concentration at day 0 between saline- and doxycycline-treated mice (Fig. 3G). Lactate production from [U-2H]-pyruvate was significantly reduced at day 7 relative to day 0 in doxycycline-treated mice, while, in contrast, lactate production was significantly higher at day 7 relative to day 0 in saline-treated animals (Fig. 3G). Importantly, there was no significant difference in tumor volume between day 0 and day 7 in doxycycline-treated animals, consistent with prior studies indicating that there is a lag period before cell death following loss of TERT (44) (Fig. 3H and Supplementary Fig. S6H).
Since TERT is a hallmark of tumor proliferation (1,2), imaging TERT can enable assessment of tumor burden in vivo. We, therefore, examined the ability of [U-2H]-pyruvate to differentiate between TERT+ tumor and TERT− normal brain in mice bearing orthotopic glioblastoma (GBM6) and oligodendroglioma (SF10417, BT88) tumors. As shown in Fig. 4A–4B, lactate production from [U-2H]-pyruvate was significantly higher in mice bearing orthotopic SF10417, BT88, or GBM6 tumors relative to healthy controls. Since widespread dissemination of 2H-MRS to the clinic depends on the feasibility of imaging metabolism at the clinical field strength of 3T, we examined [U-2H]-pyruvate metabolism in vivo at 3T. As shown in Fig. 4C–4D, lactate production from [U-2H]-pyruvate was significantly higher in mice bearing orthotopic GBM6 tumors relative to tumor-free healthy controls at 3T. Furthermore, the lactate concentrations calculated at 3T were similar to the data acquired at 14.1T (Fig. 4E).
Figure 4. [U-2H]-pyruvate metabolism to lactate differentiates tumor from normal brain in patient-derived glioma models in vivo.

(A) Representative 2H-MR spectra acquired at 14.1T after intravenous injection of [U-2H]-pyruvate into a mouse bearing an orthotopic SF10417 oligodendroglioma tumor (top row) or a tumor-free healthy control (bottom row). In each case, the spectrum with the maximum lactate signal (2nd spectrum following injection of [U-2H]-pyruvate) is shown. (B) Quantification of 2H-lactate production from [U-2H]-pyruvate at 14.1T in mice carrying orthotopic glioblastoma (GBM6) tumors, orthotopic oligodendroglioma (BT88, SF10417) tumors or tumor-free healthy mice. (C) Representative 2H-MR spectra acquired at 3T after intravenous injection of [U-2H]-pyruvate into a mouse bearing an orthotopic glioblastoma (GBM6; top row) or a tumor-free healthy control (bottom row). In each case, the spectrum with the maximum lactate signal (2nd spectrum following injection of [U-2H]-pyruvate) is shown. (D) Quantification of 2H-lactate production from [U-2H]-pyruvate in mice carrying orthotopic glioblastoma (GBM6) tumors or tumor-free healthy mice. (E) Comparison of lactate concentration evaluated at 3T and 14.1T in mice carrying orthotopic glioblastoma (GBM6) tumors or tumor-free healthy mice. Bars depict mean values and error bars represent standard deviation. *** represents p<0.001.
To further confirm these results and examine the spatial distribution of [U-2H]-pyruvate metabolism, we performed 2D CSI in vivo. Representative 2H-MR spectra from voxels placed over tumor or contralateral normal brain in a mouse bearing an orthotopic GBM1 tumor are shown in Fig. 5A. Quantification of the data confirmed significantly higher lactate labeling in tumor vs. contralateral normal brain (Fig. 5B). Importantly, examination of heatmaps in which the lactate signal was overlaid over the corresponding MRI indicated that lactate production from [U-2H]-pyruvate delineated tumor from surrounding normal brain in the BT88 and GBM1 models (Fig. 5C–5D). Collectively, our results indicate that lactate production from [U-2H]-pyruvate is a biomarker of TERT expression and point to its utility for imaging tumor burden in vivo.
Figure 5. [U-2H]-pyruvate monitors tumor burden in vivo.

(A) Representative 2D CSI data showing the T2-weighted MRI and corresponding 2H-MR spectra from voxels placed over the tumor and contralateral normal brain in a mouse bearing an orthotopic GBM1 tumor. Tumor voxel and spectra are shown in blue and contralateral normal brain voxel and spectra in green. The tumor region is contoured by white dotted lines. (B) Quantification of 2H-lactate concentration in a 10.99mm3 region of interest within the tumor or contralateral normal brain from 2D CSI studies in mice bearing orthotopic GBM1 or BT88 tumors. Representative heatmaps of 2H-lactate SNR or 2H-lactate concentration from 2D CSI studies in mice bearing orthotopic BT88 (C) or GBM1 (D) tumors. In each case, the left panel shows the T2-weighted MRI with the tumor region contoured in white, the middle panel shows the corresponding heatmap of 2H-lactate SNR while the right panel shows the heatmap of 2H-lactate concentration. The same representative dataset was used in (A) and (D). * represents p<0.05.
Lactate production from [U-2H]-pyruvate is an early biomarker of response to therapy in vivo
Early assessment of response to therapy is a significant challenge in the clinic (10–12). We examined the ability of [U-2H]-pyruvate to report on response to treatment with a TERT inhibitor in vivo. 6-thio-dG is an analog of the TERT substrate 6-thio-dGTP that induces telomere uncapping in TERT+ cells and is in clinical trials for solid tumors (NCT05208944) (7,8). We treated mice bearing orthotopic glioblastoma (GBM6) or oligodendroglioma (BT88) xenografts with 6-thio-dG and examined [U-2H]-pyruvate metabolism before (day 0) and after (day 6±1) treatment. T2-weighted MRI indicated that 6-thio-dG induced tumor shrinkage, an effect that was significant starting day 14±1 for both models (Fig. 6A–6B). Importantly, lactate production from [U-2H]-pyruvate was significantly reduced at an early time-point (day 6±1) before a change in tumor volume could be detected (Fig. 6C–6D).
Figure 6. Lactate production from [U-2H]-pyruvate is an early biomarker of response to therapy in vivo.

(A) Representative T2-weighted MRI of mice bearing orthotopic GBM6 (top row) or BT88 (bottom row) tumors before (day 0) and after (day 7) treatment with 6-thio-dG. (B) Effect of 6-thio-dG on tumor volume over time in mice bearing orthotopic GBM6 or BT88 tumor xenografts. (C) Representative spectra of [U-2H]-pyruvate metabolism from a mouse bearing an orthotopic GBM6 glioblastoma tumor before (day 0, top) and after (day 7, bottom) 6-thio-dG treatment. (D) Quantification of 2H-lactate production from [U-2H]-pyruvate before (day 0) and after (day 6±1) treatment with 6-thio-dG in mice bearing orthotopic GBM6 or BT88 tumors. (E) Representative T2-weighted MRI of mice bearing orthotopic GBM6 (top row) or BT88 (bottom row) tumors before (day 0) and after (day 4 or day 7 respectively) treatment with TMZ. (F) Effect of TMZ on tumor volume over time in mice bearing orthotopic GBM6 or BT88 tumor xenografts. (G) Representative spectra of [U-2H]-pyruvate metabolism from a mouse bearing an orthotopic GBM6 glioblastoma tumor before (day 0, top) and after (day 3, bottom) TMZ treatment. (H) Quantification of 2H-lactate production from [U-2H]-pyruvate before (day 0) and after (day 5±2) treatment with TMZ in mice bearing orthotopic GBM6 or BT88 tumors. Bars depict mean values and error bars represent standard deviation. * represents p<0.05, ** represents p<0.01, *** represents p<0.001 and **** represents p<0.0001.
TERT is a biomarker of tumor proliferation and imaging biomarkers of TERT also have the potential to report on response to cytocidal therapeutics. We, therefore, examined whether [U-2H]-pyruvate reports on response to TMZ, which is an alkylating chemotherapeutic that is standard of care for glioma patients (45). We examined the effect of TMZ on tumor volume and [U-2H]-pyruvate metabolism in mice bearing orthotopic glioblastoma (GBM6) or oligodendroglioma (BT88). TMZ induced tumor shrinkage in vivo, an effect that was visible at day 9±1 in the GBM6 model and day 16±2 in the BT88 model (Fig. 6E–6F). Importantly, [U-2H]-pyruvate metabolism to lactate was significantly reduced at day 5±2 following TMZ treatment (Fig. 6G–6H), prior to tumor shrinkage. Furthermore, 2H-lactate production was reduced despite higher vascular perfusion as measured by DCE-MRI (Supplementary Fig. S7A–S7C). Collectively, these results suggest that lactate production from [U-2H]-pyruvate is an early biomarker of response to therapy in vivo.
DISCUSSION
TERT is essential for immortality in ~85% of all human cancers (1,2). In this study, we show that TERT expression results in elevated levels of NADH and an elevated NADH/NAD+ ratio in multiple cancers, including glioblastoma, oligodendroglioma, melanoma, neuroblastoma, and hepatocellular carcinoma. Importantly, we show that [U-2H]-pyruvate can be used to non-invasively monitor TERT in vivo.
Our study identifies a role for TERT in regulating glycolysis and redox via the transcription factor FOXO1. TERT expression is associated with inhibitory phosphorylation and cytosolic sequestration of FOXO1. FOXO1, in turn, negatively regulates NAMPT, which is the rate-limiting enzyme in NAD+ biosynthesis (27). As a result, TERT upregulates NAMPT, resulting in elevated steady-state pools of NAD+ and NADH. Concomitantly, FOXO1 negatively regulates the glycolytic enzyme GAPDH, which converts NAD+ to NADH. As a result, TERT upregulates the NADH/NAD+ ratio (see schematic in Fig. 1D). Therefore, although we cannot rule out the involvement of other molecular factors in glycolytic flux, and the precise mechanism by which TERT mediates FOXO1 phosphorylation remains to be delineated, our studies highlight a previously unrecognized TERT-FOXO1 axis in cancer metabolic reprogramming.
We have, for the first time, validated the utility of [U-2H]-pyruvate as a metabolic imaging agent and, importantly, demonstrated that lactate production from [U-2H]-pyruvate is linked to TERT expression. To be useful, a biomarker needs to be mechanistically linked to the biological event under consideration, even if it is not exclusively linked only to that event. Therefore, although decreased lactate production from [U-2H]-pyruvate may not be specific to only TERT, nevertheless, it provides a non-invasive readout of this critical oncogenic event in vivo. Direct in vivo 1H-MRS-based detection of NAD(H) (representing the sum of NAD+ and NADH since these cannot be spectrally resolved) is complicated by issues of water suppression and the need for highly specialized acquisition schemes (46). Lactate production from pyruvate is directly dependent on NADH and has long been used as a surrogate for interrogating NADH and the NADH/NAD+ ratio in cell extracts (40,41). Our studies indicate that [U-2H]-pyruvate flux to lactate is mechanistically linked to the TERT-mediated increase in NADH and the NADH/NAD+ ratio. 2H-MRS recently emerged as a novel method of imaging metabolism in vivo (21–26). Importantly, the feasibility of monitoring tumor burden using 2H-glucose has been demonstrated in vivo in glioblastoma patients (21). Our studies extend the utility of 2H-MRS by leveraging a hitherto unexplored probe, i.e. [U-2H]-pyruvate, for monitoring TERT expression, including at the clinical field strength of 3T. Our studies are especially important in light of our observation that TERT expression does not alter steady-state lactate levels, pointing to the value of dynamic 2H-MRS-based metabolic imaging of TERT expression.
Previous studies indicate that lactate production from hyperpolarized [1-13C]-pyruvate can be used for treatment response assessment in cancer (20,47). However, hyperpolarized 13C imaging is limited by the short lifetime of hyperpolarization and the requirement for access to expensive polarizers (20,47). In this context, it should be noted that 2H-MRS following administration of [U-2H]-pyruvate provides a robust, lower-cost, easy-to-implement method of interrogating pyruvate flux to lactate (48). Importantly, [U-2H]-pyruvate is a safe, endogenous agent that has the properties needed for clinical application. First, while the concentration of [U-2H]-pyruvate used in our experiments (450 mg/kg) is 2-4 times higher than the concentration of hyperpolarized [1-13C]-pyruvate used in preclinical models (20,47), it is similar to concentrations used in other preclinical studies showing a neuroprotective effect of pyruvate following severe hypoglycemia (49). Notably, we did not observe any toxicity with [U-2H]-pyruvate in our experiments. Studies with hyperpolarized [1-13C]-pyruvate have also established the safety of intravenous pyruvate administration in patients (47,50). Second, although most of our studies were conducted at 14.1T, we have demonstrated the feasibility of detecting lactate production from [U-2H]-pyruvate with adequate spectral resolution at the clinical field strength of 3T. Third, the ability to cross the blood-brain barrier is important for imaging brain tumors, especially non-contrast enhancing low-grade gliomas (20). Our studies indicate that [U-2H]-pyruvate is capable of imaging tumor burden and treatment response in patient-derived low-grade oligodendrogliomas. In essence, [U-2H]-pyruvate has the potential to become a versatile, broadly applicable tool for metabolic imaging in oncology.
Our study highlights the ability of [U-2H]-pyruvate to provide an early readout of response to therapy in vivo. At present, response assessment in solid tumors is based on changes in tumor volume, which can take considerable time to manifest (10,11). Using tumor models in which TERT is silenced in a doxycycline-inducible manner, we show that loss of TERT leads to reduced lactate production from [U-2H]-pyruvate. We also demonstrate that pharmacological inhibition of TERT using 6-thio-dG or chemotherapeutic inhibition of tumor proliferation using TMZ is accompanied by reduced [U-2H]-pyruvate flux to lactate. Importantly, reduced lactate production is observed at early timepoints at which volumetric alterations cannot be observed by MRI. In essence, [U-2H]-pyruvate has the potential to serve as a companion agent for imaging response to standard and emerging anti-cancer therapies, thereby aiding in their clinical translation and deployment.
In summary, our studies integrate a mechanistic understanding of TERT biology with innovative imaging that has the potential to improve assessment of tumor burden and treatment response for cancer patients. Clinical translation of our results has the potential to enable non-invasive annotation of TERT expression in vivo and to aid in the assessment of response to anti-cancer therapies.
Supplementary Material
TRANSLATIONAL RELEVANCE.
There is an urgent need to translate our understanding of clinically relevant oncogenic mutations into easy-to-implement imaging methods that guide diagnosis, treatment, and response assessment for cancer patients. Here, we show that telomerase reverse transcriptase (TERT), which is essential for uncontrolled tumor proliferation, elevates levels of the redox metabolite NADH by regulating the activity of the transcription factor FOXO1. Importantly, we show that deuterium metabolic imaging using a hitherto unexplored probe, [U-2H]-pyruvate, allows non-invasive assessment of TERT-associated NADH in clinically relevant patient-derived tumor models. By doing so, [U-2H]-pyruvate provides an early readout of response to therapy in vivo that precedes anatomical alterations as assessed by magnetic resonance imaging. Since deuterium metabolic imaging is a technically simple, robust imaging modality, clinical translation of deuterated pyruvate will provide physicians with a non-invasive, non-radioactive method of longitudinally monitoring disease progression and evaluating the effectiveness of therapy, including novel targeted inhibitors in clinical trials.
Financial support:
This work was funded by the National Institutes of Health (NIH R01CA239288, NIH P30CA082103 and NCI F31CA254067), Department of Defense (W81XWH201055315), the Hana Jabsheh Foundation, and the UCSF NICO Initiative.
Footnotes
Conflict of interests: J.F.C. is a co-founder of Telo Therapeutics and has investment interests. The other authors declare no potential conflicts of interest.
REFERENCES
- 1.Shay JW, Wright WE. Telomeres and telomerase: three decades of progress. Nature Reviews Genetics 2019;20(5):299–309 doi 10.1038/s41576-019-0099-1. [DOI] [PubMed] [Google Scholar]
- 2.Bell RJ, Rube HT, Xavier-Magalhaes A, Costa BM, Mancini A, Song JS, et al. Understanding TERT Promoter Mutations: A Common Path to Immortality. Molecular cancer research : MCR 2016;14(4):315–23 doi 10.1158/1541-7786.mcr-16-0003. [DOI] [PMC free article] [PubMed] [Google Scholar]
- 3.Chiba K, Johnson JZ, Vogan JM, Wagner T, Boyle JM, Hockemeyer D. Cancer-associated TERT promoter mutations abrogate telomerase silencing. eLife 2015;4 doi 10.7554/eLife.07918. [DOI] [PMC free article] [PubMed] [Google Scholar]
- 4.Bell RJ, Rube HT, Kreig A, Mancini A, Fouse SD, Nagarajan RP, et al. Cancer. The transcription factor GABP selectively binds and activates the mutant TERT promoter in cancer. Science 2015;348(6238):1036–9 doi 10.1126/science.aab0015. [DOI] [PMC free article] [PubMed] [Google Scholar]
- 5.Akincilar SC, Khattar E, Boon PL, Unal B, Fullwood MJ, Tergaonkar V. Long-Range Chromatin Interactions Drive Mutant TERT Promoter Activation. Cancer discovery 2016;6(11):1276–91 doi 10.1158/2159-8290.Cd-16-0177. [DOI] [PubMed] [Google Scholar]
- 6.Mancini A, Xavier-Magalhaes A, Woods WS, Nguyen KT, Amen AM, Hayes JL, et al. Disruption of the beta1L Isoform of GABP Reverses Glioblastoma Replicative Immortality in a TERT Promoter Mutation-Dependent Manner. Cancer cell 2018;34(3):513–28 e8. [DOI] [PMC free article] [PubMed] [Google Scholar]
- 7.Mender I, Gryaznov S, Dikmen ZG, Wright WE, Shay JW. Induction of telomere dysfunction mediated by the telomerase substrate precursor 6-thio-2’-deoxyguanosine. Cancer discovery 2015;5(1):82–95 doi 10.1158/2159-8290.Cd-14-0609. [DOI] [PMC free article] [PubMed] [Google Scholar]
- 8.Sengupta S, Sobo M, Lee K, Senthil Kumar S, White AR, Mender I, et al. Induced Telomere Damage to Treat Telomerase Expressing Therapy-Resistant Pediatric Brain Tumors. Molecular cancer therapeutics 2018;17(7):1504–14 doi 10.1158/1535-7163.Mct-17-0792. [DOI] [PubMed] [Google Scholar]
- 9.Kauppinen RA, Peet AC. Using magnetic resonance imaging and spectroscopy in cancer diagnostics and monitoring: preclinical and clinical approaches. Cancer Biol Ther 2011;12(8):665–79 doi 10.4161/cbt.12.8.18137. [DOI] [PMC free article] [PubMed] [Google Scholar]
- 10.García-Figueiras R, Baleato-González S, Padhani AR, Luna-Alcalá A, Vallejo-Casas JA, Sala E, et al. How clinical imaging can assess cancer biology. Insights Imaging 2019;10(1):28 doi 10.1186/s13244-019-0703-0. [DOI] [PMC free article] [PubMed] [Google Scholar]
- 11.Brindle K New approaches for imaging tumour responses to treatment. Nature reviews Cancer 2008;8(2):94–107 doi 10.1038/nrc2289. [DOI] [PubMed] [Google Scholar]
- 12.Hygino da Cruz LC, Rodriguez I, Domingues RC, Gasparetto EL, Sorensen AG. Pseudoprogression and Pseudoresponse: Imaging Challenges in the Assessment of Posttreatment Glioma. American Journal of Neuroradiology 2011;32(11):1978 doi 10.3174/ajnr.A2397. [DOI] [PMC free article] [PubMed] [Google Scholar]
- 13.Indran IR, Hande MP, Pervaiz S. hTERT overexpression alleviates intracellular ROS production, improves mitochondrial function, and inhibits ROS-mediated apoptosis in cancer cells. Cancer research 2011;71(1):266–76 doi 10.1158/0008-5472.can-10-1588. [DOI] [PubMed] [Google Scholar]
- 14.Ahmad F, Dixit D, Sharma V, Kumar A, Joshi SD, Sarkar C, et al. Nrf2-driven TERT regulates pentose phosphate pathway in glioblastoma. Cell death & disease 2016;7:e2213 doi 10.1038/cddis.2016.117. [DOI] [PMC free article] [PubMed] [Google Scholar]
- 15.Viswanath P, Batsios G, Ayyappan V, Taglang C, Gillespie AM, Larson PEZ, et al. Metabolic imaging detects elevated glucose flux through the pentose phosphate pathway associated with TERT expression in low-grade gliomas. Neuro-oncology 2021. doi 10.1093/neuonc/noab093. [DOI] [PMC free article] [PubMed] [Google Scholar]
- 16.Viswanath P, Batsios G, Mukherjee J, Gillespie AM, Larson PEZ, Luchman HA, et al. Non-invasive assessment of telomere maintenance mechanisms in brain tumors. Nature communications 2021;12(1):92 doi 10.1038/s41467-020-20312-y. [DOI] [PMC free article] [PubMed] [Google Scholar]
- 17.Glunde K, Bhujwalla ZM. Metabolic Tumor Imaging Using Magnetic Resonance Spectroscopy. Seminars in Oncology 2011;38(1):26–41 doi 10.1053/j.seminoncol.2010.11.001. [DOI] [PMC free article] [PubMed] [Google Scholar]
- 18.Ruiz-Rodado V, Brender JR, Cherukuri MK, Gilbert MR, Larion M. Magnetic resonance spectroscopy for the study of cns malignancies. Prog Nucl Magn Reson Spectrosc 2021;122:23–41 doi 10.1016/j.pnmrs.2020.11.001. [DOI] [PMC free article] [PubMed] [Google Scholar]
- 19.Ishii N, Nakahigashi K, Baba T, Robert M, Soga T, Kanai A, et al. Multiple high-throughput analyses monitor the response of E. coli to perturbations. Science 2007;316(5824):593–7 doi 10.1126/science.1132067. [DOI] [PubMed] [Google Scholar]
- 20.Viswanath P, Li Y, Ronen SM. C-13 Hyperpolarized MR Spectroscopy for Metabolic Imaging of Brain Tumors. In: Pope WB, editor. Glioma Imaging: Physiologic, Metabolic, and Molecular Approaches. Cham: Springer International Publishing; 2020. p. 191–209. [Google Scholar]
- 21.De Feyter HM, Behar KL, Corbin ZA, Fulbright RK, Brown PB, McIntyre S, et al. Deuterium metabolic imaging (DMI) for MRI-based 3D mapping of metabolism in vivo. Sci Adv 2018;4(8):eaat7314. [DOI] [PMC free article] [PubMed] [Google Scholar]
- 22.Hesse F, Somai V, Kreis F, Bulat F, Wright AJ, Brindle KM. Monitoring tumor cell death in murine tumor models using deuterium magnetic resonance spectroscopy and spectroscopic imaging. Proceedings of the National Academy of Sciences of the United States of America 2021;118(12) doi 10.1073/pnas.2014631118. [DOI] [PMC free article] [PubMed] [Google Scholar]
- 23.Kreis F, Wright AJ, Hesse F, Fala M, Hu DE, Brindle KM. Measuring Tumor Glycolytic Flux in Vivo by Using Fast Deuterium MRI. Radiology 2020;294(2):289–96 doi 10.1148/radiol.2019191242. [DOI] [PubMed] [Google Scholar]
- 24.Lu M, Zhu XH, Zhang Y, Mateescu G, Chen W. Quantitative assessment of brain glucose metabolic rates using in vivo deuterium magnetic resonance spectroscopy. Journal of cerebral blood flow and metabolism : official journal of the International Society of Cerebral Blood Flow and Metabolism 2017;37(11):3518–30. [DOI] [PMC free article] [PubMed] [Google Scholar]
- 25.Markovic S, Roussel T, Agemy L, Sasson K, Preise D, Scherz A, et al. Deuterium MRSI characterizations of glucose metabolism in orthotopic pancreatic cancer mouse models. NMR in biomedicine 2021;34(9):e4569 doi 10.1002/nbm.4569. [DOI] [PubMed] [Google Scholar]
- 26.Taglang C, Batsios G, Mukherjee J, Tran M, Gillespie AM, Hong D, et al. Deuterium magnetic resonance spectroscopy enables non-invasive metabolic imaging of tumor burden and response to therapy in low-grade gliomas. Neuro-oncology 2022. doi 10.1093/neuonc/noac022. [DOI] [PMC free article] [PubMed] [Google Scholar]
- 27.Garten A, Petzold S, Körner A, Imai S-i, Kiess W. Nampt: linking NAD biology, metabolism and cancer. Trends in Endocrinology & Metabolism 2009;20(3):130–8 doi 10.1016/j.tem.2008.10.004. [DOI] [PMC free article] [PubMed] [Google Scholar]
- 28.Sarkaria JN, Carlson BL, Schroeder MA, Grogan P, Brown PD, Giannini C, et al. Use of an orthotopic xenograft model for assessing the effect of epidermal growth factor receptor amplification on glioblastoma radiation response. Clinical cancer research : an official journal of the American Association for Cancer Research 2006;12(7 Pt 1):2264–71 doi 10.1158/1078-0432.Ccr-05-2510. [DOI] [PubMed] [Google Scholar]
- 29.Jones LE, Hilz S, Grimmer MR, Mazor T, Najac C, Mukherjee J, et al. Patient-derived cells from recurrent tumors that model the evolution of IDH-mutant glioma. Neurooncol Adv 2020;2(1):vdaa088. [DOI] [PMC free article] [PubMed] [Google Scholar]
- 30.Kelly JJ, Blough MD, Stechishin OD, Chan JA, Beauchamp D, Perizzolo M, et al. Oligodendroglioma cell lines containing t(1;19)(q10;p10). Neuro-oncology 2010;12(7):745–55 doi 10.1093/neuonc/noq031. [DOI] [PMC free article] [PubMed] [Google Scholar]
- 31.Viswanath P, Radoul M, Izquierdo-Garcia JL, Luchman HA, Gregory Cairncross J, Pieper RO, et al. Mutant IDH1 gliomas downregulate phosphocholine and phosphoethanolamine synthesis in a 2-hydroxyglutarate-dependent manner. Cancer & metabolism 2018;6:3 doi 10.1186/s40170-018-0178-3. [DOI] [PMC free article] [PubMed] [Google Scholar]
- 32.Viswanath P, Radoul M, Izquierdo-Garcia JL, Ong WQ, Luchman HA, Cairncross JG, et al. 2-hydroxyglutarate-mediated autophagy of the endoplasmic reticulum leads to an unusual downregulation of phospholipid biosynthesis in mutant IDH1 gliomas. Cancer research 2018. doi 10.1158/0008-5472.can-17-2926. [DOI] [PMC free article] [PubMed] [Google Scholar]
- 33.Ohba S, Mukherjee J, Johannessen TC, Mancini A, Chow TT, Wood M, et al. Mutant IDH1 Expression Drives TERT Promoter Reactivation as Part of the Cellular Transformation Process. Cancer research 2016;76(22):6680–9. [DOI] [PMC free article] [PubMed] [Google Scholar]
- 34.Schnater JM, Bruder E, Bertschin S, Woodtli T, de Theije C, Pietsch T, et al. Subcutaneous and intrahepatic growth of human hepatoblastoma in immunodeficient mice. Journal of hepatology 2006;45(3):377–86 doi 10.1016/j.jhep.2006.03.018. [DOI] [PubMed] [Google Scholar]
- 35.Batsios G, Viswanath P, Subramani E, Najac C, Gillespie AM, Santos RD, et al. PI3K/mTOR inhibition of IDH1 mutant glioma leads to reduced 2HG production that is associated with increased survival. Sci Rep 2019;9(1):10521 doi 10.1038/s41598-019-47021-x. [DOI] [PMC free article] [PubMed] [Google Scholar]
- 36.Gorrini C, Harris IS, Mak TW. Modulation of oxidative stress as an anticancer strategy. Nat Rev Drug Discov 2013;12(12):931–47 doi 10.1038/nrd4002. [DOI] [PubMed] [Google Scholar]
- 37.Xie N, Zhang L, Gao W, Huang C, Huber PE, Zhou X, et al. NAD(+) metabolism: pathophysiologic mechanisms and therapeutic potential. Signal Transduct Target Ther 2020;5(1):227 doi 10.1038/s41392-020-00311-7. [DOI] [PMC free article] [PubMed] [Google Scholar]
- 38.Gross DN, van den Heuvel APJ, Birnbaum MJ. The role of FoxO in the regulation of metabolism. Oncogene 2008;27(16):2320–36 doi 10.1038/onc.2008.25. [DOI] [PubMed] [Google Scholar]
- 39.Tang ED, Nuñez G, Barr FG, Guan KL. Negative regulation of the forkhead transcription factor FKHR by Akt. The Journal of biological chemistry 1999;274(24):16741–6 doi 10.1074/jbc.274.24.16741. [DOI] [PubMed] [Google Scholar]
- 40.Day SE, Kettunen MI, Gallagher FA, Hu DE, Lerche M, Wolber J, et al. Detecting tumor response to treatment using hyperpolarized 13C magnetic resonance imaging and spectroscopy. Nat Med 2007;13(11):1382–7 doi 10.1038/nm1650. [DOI] [PubMed] [Google Scholar]
- 41.Williamson DH, Lund P, Krebs HA. The redox state of free nicotinamide-adenine dinucleotide in the cytoplasm and mitochondria of rat liver. The Biochemical journal 1967;103(2):514–27 doi 10.1042/bj1030514. [DOI] [PMC free article] [PubMed] [Google Scholar]
- 42.Guarino VA, Oldham WM, Loscalzo J, Zhang YY. Reaction rate of pyruvate and hydrogen peroxide: assessing antioxidant capacity of pyruvate under biological conditions. Sci Rep 2019;9(1):19568 doi 10.1038/s41598-019-55951-9. [DOI] [PMC free article] [PubMed] [Google Scholar]
- 43.Arce-Molina R, Cortés-Molina F, Sandoval PY, Galaz A, Alegría K, Schirmeier S, et al. A highly responsive pyruvate sensor reveals pathway-regulatory role of the mitochondrial pyruvate carrier MPC. eLife 2020;9 doi 10.7554/eLife.53917. [DOI] [PMC free article] [PubMed] [Google Scholar]
- 44.Patel PL, Suram A, Mirani N, Bischof O, Herbig U. Derepression of hTERT gene expression promotes escape from oncogene-induced cellular senescence. Proceedings of the National Academy of Sciences 2016;113(34):E5024. [DOI] [PMC free article] [PubMed] [Google Scholar]
- 45.Weller M, van den Bent M, Preusser M, Le Rhun E, Tonn JC, Minniti G, et al. EANO guidelines on the diagnosis and treatment of diffuse gliomas of adulthood. Nat Rev Clin Oncol 2020. doi 10.1038/s41571-020-00447-z. [DOI] [PMC free article] [PubMed] [Google Scholar]
- 46.de Graaf RA, Behar KL. Detection of cerebral NAD(+) by in vivo (1)H NMR spectroscopy. NMR in biomedicine 2014;27(7):802–9 doi 10.1002/nbm.3121. [DOI] [PMC free article] [PubMed] [Google Scholar]
- 47.Kurhanewicz J, Vigneron DB, Ardenkjaer-Larsen JH, Bankson JA, Brindle K, Cunningham CH, et al. Hyperpolarized (13)C MRI: Path to Clinical Translation in Oncology. Neoplasia (New York, NY) 2019;21(1):1–16. [DOI] [PMC free article] [PubMed] [Google Scholar]
- 48.De Feyter HM, de Graaf RA. Deuterium metabolic imaging - Back to the future. Journal of magnetic resonance (San Diego, Calif : 1997) 2021;326:106932 doi 10.1016/j.jmr.2021.106932. [DOI] [PMC free article] [PubMed] [Google Scholar]
- 49.Suh SW, Aoyama K, Matsumori Y, Liu J, Swanson RA. Pyruvate administered after severe hypoglycemia reduces neuronal death and cognitive impairment. Diabetes 2005;54(5):1452–8 doi 10.2337/diabetes.54.5.1452. [DOI] [PubMed] [Google Scholar]
- 50.Nelson SJ, Kurhanewicz J, Vigneron DB, Larson PE, Harzstark AL, Ferrone M, et al. Metabolic imaging of patients with prostate cancer using hyperpolarized [1-(1)(3)C]pyruvate. Science translational medicine 2013;5(198):198ra08 doi 10.1126/scitranslmed.3006070. [DOI] [PMC free article] [PubMed] [Google Scholar]
Associated Data
This section collects any data citations, data availability statements, or supplementary materials included in this article.
Supplementary Materials
Data Availability Statement
Data included in this manuscript that support the findings and conclusions of this study are available from the corresponding author upon reasonable request.