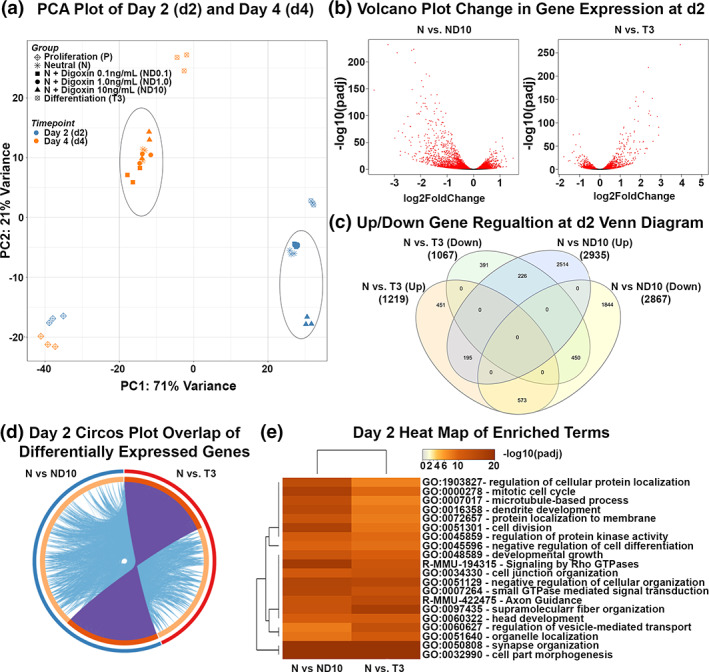
FIGURE 1.

Effects of digoxin treatment on gene expression of C57BL/6J OPCs in vitro. Proliferating mixed male and female C57BL/6J mouse OPC cultures, including PDGF, were passaged two times prior to treatment. OPC cultures were changed to media without PDGF and treated with vehicle (termed neutral), the indicated concentrations of digoxin (0.1, 1.0, or 10 ng/ml), or T3 (differentiation control). Total RNA was isolated from snap‐frozen OL lineage cells at 48 h (d2) or 96 h (d4). Principal component analysis (PCA) of variation of gene expression within and between treatment groups and time points. Horizontal and vertical axis show two principal components that explain the greatest proportion (71% and 21%) of variation (a). Volcano plots display the differentially expressed genes at d2. The y‐axis corresponds to the FDR adjusted p‐value (−log10) and the x‐axis displays the fold change (log2). The red dots represent the significant genes. Positive x‐values represent up‐regulation and negative x‐values represent down‐regulation (b). Venn diagram displays the number of significantly differentially expressed genes (up or down regulated) at d2. Differential expression was determined using DESeq2 and the cutoff for determining significantly differentially expressed genes was an FDR‐adjusted p < .05 (c). Circos plot shows the overlap between gene lists, where purple curves link identical genes and blue curves link genes that belong to the same enriched ontology term. The inner circle represents gene lists, where hits are arranged along the arc. Genes that hit multiple lists are colored in dark orange, and genes unique to a list are shown in light orange (d). Heatmap shows the top 20 enriched clusters across d2 colored by significance, FDR adjusted p‐value (−log10) (e).
