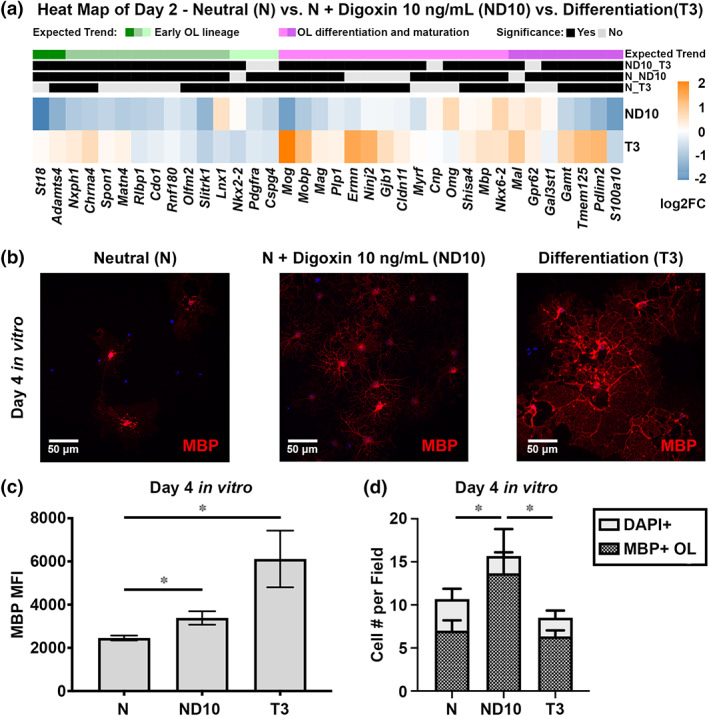
FIGURE 2.

Effects of digoxin treatment on differentiation of C57BL/6J OPCs in vitro. Heatmap shows relative expression of genes as fold change (log2) based on expected trend at d2. Orange color indicates relative upregulation, whereas blue indicated relative down regulation. Row annotations mark different expected trends, including early OL lineage genes (green) and OL differentiation and maturation genes (purple). Genes that were significantly differentially expressed are marked in black (a). Immunofluorescent staining of myelin basic protein (MBP) was carried out with representative images for the various treatment groups shown (b) and MBP staining quantitated with results presented as mean fluorescent intensity (MFI) (c) as well as cell number co‐labeling with nuclear staining (DAPI) (d) (n = 3 biological samples/group with n = 2 technical replicates). (*p < .05).
