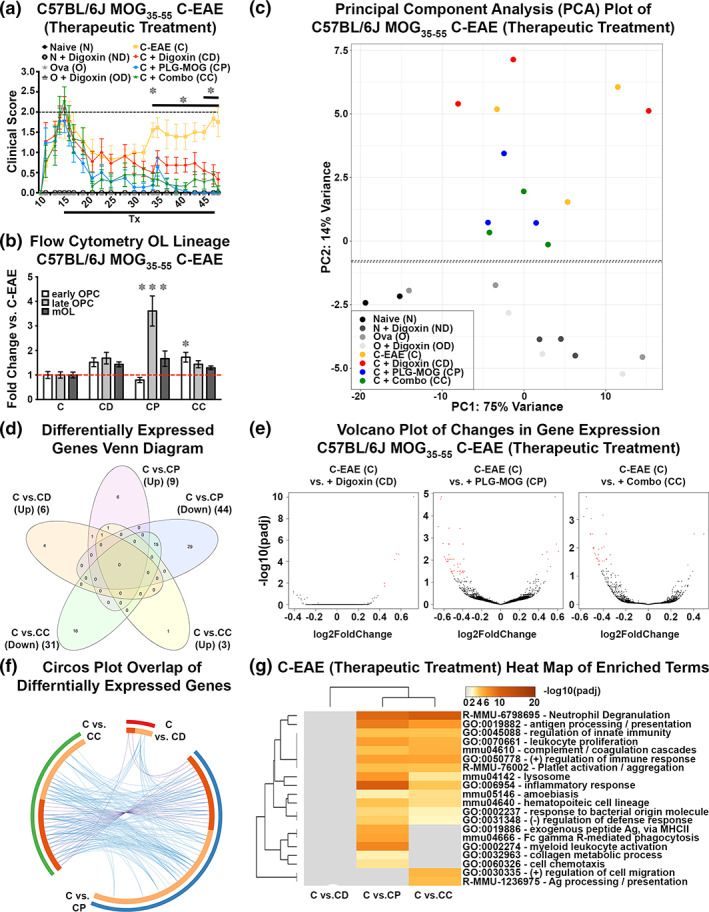
FIGURE 6.

Combined therapeutic treatment with digoxin and MOG35‐55‐specific tolerance ameliorated disease progression in female C57BL/6J C‐EAE. 8‐week‐old female C57BL/6J mice remained naïve (N), or were primed with OVA323‐339 (O), or primed with MOG35‐55 to induce C‐EAE (C). At peak (d15), the MOG35‐55 primed mice were treated (Tx) with vehicle (C) (n = 9) or treated with a single i.v. infusion PLG‐MOG35‐55 nanoparticles alone (CP) (n = 11), digoxin alone (CD) 0.3 mg/kg i.p. qad for 1 month through d46 (n = 11), or with the combination (CC) of PLG‐MOG35‐55 + digoxin (n = 9). Clinical scores were monitored until d47 (a): Compared to MOG primed + vehicle, there was a significant decrease in clinical score in d34 ‐ d47 (PLG and combination) and at d34/d45‐d47 (digoxin). During d35‐d44, the digoxin cohort is not significantly different from the PLG or combo. On d47, forebrain and spinal cord tissue from perfused mice (n = 3–6 mice/group) was collected and processed for flow cytometric analysis of OL lineage cells (measured % CNS resident cells in treatment groups as a fold change compared to vehicle control MOG35‐55 primed C‐EAE) (b) and for RNASeq analysis (c–g). PCA shows variation within and between groups. Horizontal and vertical axis show two principal components that explain the greatest proportion (75% and 14%) of variation (c). Venn diagram displays the number of significantly differentially expressed genes in C57BL/6J MOG35 C‐EAE (therapeutic treatment). Differential expression was determined using DESeq2 and the cutoff for determining significantly differentially expressed genes was an FDR‐adjusted p‐value <.05 (d). Volcano plots displays the differentially expressed genes in C57BL/6J MOG35 C‐EAE (therapeutic treatment). The vertical axis (y‐axis) corresponds to the FDR adjusted p‐value (−log10), and the horizontal axis (x‐axis) displays the fold change (log2). The red dots represent the significant genes. Positive x‐values represent up‐regulation and negative x‐values represent down‐regulation (e). Circos plot shows the overlap between gene lists, where purple curves link identical genes and blue curves link genes that belong to the same enriched ontology term. The inner circle represents gene lists, where hits are arranged along the arc. Genes that hit multiple lists are colored in dark orange, and genes unique to a list are shown in light orange (f). The heatmap shows the top 20 enriched clusters across C57BL/6J MOG35 C‐EAE (therapeutic treatment), colored by significance, FDR adjusted p‐value (−log10) (g). (*p < .05, **p < .01, ***p < .001). Extended data for Figure 6 is labeled as Figure S3.
